Data Humanities

Mathematics is usually not regared as a science but as part of philosophy - although it has some relation to the "real world" - as shown in this 18 century cut.
Mathematics is usually not regared as a science but as part of philosophy – although it has some relation to the “real world” – as shown in this 18 century cut.
There is a reason why we differentiate science and the humanities. And although sociology, experimental psychology and even history nowadays deploy many scientific methods, the difference is still fundamental. Humantites deal with correlations; the causalities are way further speculative than the “laws of nature” that are formulated in physics or chemistry. Also the data that supports social research is always and inherrently biased, no matter how much care we take in sampling, representativeness and other precautions we might take.

In her remarkable talk at Strataconf, Kate Crawford warned us, that we should always suspect our “Big Data” sources as highly biased, since the standard tools of dealing with samples (as mentioned above) are usualy neglected when the data is collected.

Nevertheless, also the most biased data gives us valuable information – we just have to be careful with generalizing. Of course this is only relevant for data relating to humans using some kind of technology or service (like websites collecting cookie-data or people using some app on their phone). However, I am anyway much more interested in the humanities’ side of data: Data describing human behavior, data as an aditional dimension of people’s lives.

Taken all this, I suggest to call this field of behavior data “Data Humanities” rather than “Data Science”.

Prediction vs. Description or: Data Science vs. Market Research

“My market research indicates that 50% of your customers are above the median age. But the shocking discovery was that 50% were below the median age.”
(Dilbert; read it somewhere, cant remember the source)

It was funny to see everyone at O’Reilly’s Strata Conference talk about data science and hear just the dinosaurs like Microsoft, Intel or SAP still calling it “Big Data”. Now, for me, too, data science is the real change; and I tell you, why:

What always annoyed me when working with market researchers: you never get an answer. All you get is a description of the sample. Drawing samples was for sure a difficult task 50 years ago. You had to send interviews arround, using a kish grid (does anyone remember this – at least outside Germany?). The data had to be coded into punch cards and clumsy software was used to plot elementary descriptives from ascii-letters. If you still use SPSS, you might know what I am talking about. When I studied statistics in the early 90s, testing hypotheses was much more important than predictions, and visualisaton was not invented yet. The typical presentation of a market researcher would thus start with describing the sample (50% male, 25% from 20 to 39 years, etc.) and in the end, they would leave the client with some more or less trivialy aggregated Excel-Tables.

When I became in charge of pricing ad breaks of a large TV network, all this research was useless for my purposes. My job required predicting the measured audiences of each of the approximately 40 ad breaks for every of our four national stations six weeks in advance. I had to make the decission in real time, no matter how accurate the information I calculated the risks on would have been.

Market research is bad in supporting real time management decissions. So managers tend to decide on their “gut feelings”. But the framework has changed. The last decade brought to us the possibility to access huge data sets with low latency and run highly multivariate models. You cant do online advertising targeting based on gut feelings.

But most market researchers would still argue that the analytics behind ad targeting are not market research because they would just rely on probabilistic decissions, on predictions based on correlations rather than causality. Machine learning does not test a hypothesis that was derived from a theoretical construct of ideas. It identifies patterns and the prediction would be taken as accurate just if the effect on the ROI would be better then before.

I can very well live with the researchers keeping to their custom as long as I may use my data to do the predictions I need. When attending Strata Conference, I realized this deep paradigm shift from market research, describing data as its own end to data science, getting to predicitons.

Maybe it is thus a good thing to differentiate between market research and data science.

(This is the first in a row of posts on our impressions at Strata this year; the others will follow quickly …)

10 hot big data startups to watch in 2013

What will be the most promising startups in the Big Data field in the year 2013? Just like last year, we did a lot of research and analyses to compile our hotlist of 45 companies we think that could change the market in 2013 either through awesome product innovations or great funding rounds or take-overs. Our criteria for this hotlist were as follows:

  • Main area of business should be related to big data challenges – i.e. aggregation, storage, retrieval, analysis or visualization of large, heterogeneous or real-time data.
  • To satisfy the concept of being a startup, the company should be no older than 5 years old and not be majority owned by another company.

So, here’s the list of the top acts on the Big Data stage:

logo_10gen10gen is the Company behind MongoDB. Thus 10gen has been right in the Epicenter of Big Data. MongoDB has become synonymous with scheme free data base technology. The heap of unstructred documents that wait to be indexed is growing exponentially and will continue to rise until most document generating processes are automated (and therefor only mapping structured data form some other source). 10gen received $42M of funding in 2012 among others by the intelligence community’s VC In-Q-Tel and Sequoia Capital.

bityotaWhile MongoDB is a well known name in the NoSQL movement, you may not have heard of BitYota. This 2011 founded company that only left stealth mode in November 2012 promises to simplify Big Data storage with its Warehouse-as-a-Service approach that could be a very interesting offer for small and midsize companies with a high data analytics need. The BY management teams has a lot of experience by working the Big Data shift at companies such as Yahoo!, Oracle, Twitter and Salesforce. They received a surprising $12M in 2012 by the likes of Andreessen Horowitz, Globespan, Crosslink and others.

clearstorydataBig Data analytics, integration and exploration will be a huge topic in 2013. ClearStory Data, the company co-founded by digital serial entrepreneur Sharmila Shahani-Mulligan, has drawn a lot of attention with a $9M A round in December 2012 by KPCB, Andreessen Horowitz and Google Ventures. ClearStory’s main promise of integrating all the different and heterogeneous data sources within and around companies should be a very attractive segment of the Big Data business in the coming years. We’re eagerly awaiting the launch of this company.

climatecorpAnd now for something completely different. Climate. Insurances have always been looking into the past, modelling risks and losses – usually based on aggregated data. Climate Corporation calculates micrometeorological predictions and promises to thus to be able to offer weather related insurances far more effective. We certainly will see more such technological approaces, bridging from one “Big Data Field” to another – like Climete Corp does with weather forcast and insurances. $42M funding in 2011 and another $50M in 2012 – weather data seems to be a very promising business.

We already had this one on our last year’s list. Then in stealth mode, now – one year and $10M later – Continuuity have disclosed more of their business model. And we’re excited. When the Web started in the 90s, everyone got excited about the fantastic possibilities that html, cgi and the like would offer. But setting up a website was an expert task – just to keep the links consitent ment continuusly updating every page; this did not change until the easy-to-use content management systems where programmed, that we are all using today. With Big Data, its the same: we recognise, how great everything is in theory, but there are only few apps and the recurring tasks to maintain the environment are hardly aggregated into management tools. Continuuity builds a layer of standard APIs that translate into Hadoop and its periphery, so companies can concentrate on developing their applications instead of keeping their data running.

dataguiseOkay, this company is no longer a start-up age-wise. But it is representative of many other Big Data companies that will address a more and more important topic when it comes to the modern data environment: security. Dataguise has received $3.25M of funding in 2011 for its approach of protecting all the valuable information buried in your Hadoop clusters. Other companies on our shortlist in this field are Threat Metrix and Risk I/O.

ERNOn our hotlist, we had a lot of Big Data start-ups focusing on finance or retail. One of our favorites, ERN offers an integrated payment and loyalty solution. The founding team of this British startup hails from companies like MasterCard, Telefónica o2 or Barclay Card, so they should have good insight into the needs of this market. Up to now, they have received $2M funding. But especially with the focus on mobile transactions, we believe this market holds a lot more than that.

nuodbDatabase technology is at the core of the current Big Data revolution. But with all the talk about NoSQL, you shouldn’t say good-bye to SQL prematurely. 2013 could also be the year of the great SQL comeback. One of the people who could make this happen is NuoDB’s Jim Starkey. He developed one of the very first professional databases, Interbase, and invented the binary large object or: BLOB. Now he co-founded NuoDB and received $20M of funding in 2012 to re-invent SQL.

parstreamHere’s another non-US Big Data start-up: Germany’s Parstream. Big Data does not always mean unstructred data. Check-out-transactions, sensor data, financial record or holiday bookings are just examples of data that comes usually well structured and is kept in flat tables. However these tables can become very very large – billions, even trillions of records, millions of columns. Parstream offers highly robust data base analytics in real time with extremely low latency. No matter how big your tables are – each cell is to be addressed in milliseconds standard SQL-Statements. This makes Parstream an interesting alternative to Google’s BigQuery for applications like web analytics, smart meetering, fraud detection etc. In 2012, they received $5.6M of funding.

zoomdataOf course, as in 2012, data viz will still be one of the most fascinating Big Data topics. Zooming into data is what we are used to do with data mining tools – to quickly cut any kind of cross section and drag-and-drop the results into well formated reports. However this was only working on static dumps. Zoomdata offers seamless data access on data streamed from any kind of input source in real time with state-of-the-art visualisation that users can swipe together from the menu in real time. Still at seed stage with $1.1M of funding, we’re looking forward to hearing from this company.

Social Sensors

“So, what’s the mood of America?”
Interface, 1994

One of the most fascinating novels so far on data-driven politics is Neal Stephenson’s and J. Frederick George’s “Interface“, first published in 1994. Although written almost 20 years ago, many of the technologies discussed in this book, would still be cutting edge if employed right now in 2013. One of the most original political devices is the PIPER wristwatch, a device for watching political content such as debates or candidate’s news coverage, while analyzing the wearers’ emotional reaction to these images in real-time by measuring bodily reactions such as pulse, blood pressure or galvanic skin response. This device is a miniaturized polygraph embedded in a controlled political feedback loop.

Social sensors on Twitter for conversations and trends in modern arts

What’s really interesting about the PIPER project: These sensors are not applied to all Americans or to a sample of them, but to a rather small number of types. Here are some examples from a rather extensive list of the types that are monitored this way (p. 360-1):

  • irrelevant mouth breather
  • 400-pound tab drinker
  • burger-flipping history major
  • bible-slinging porch monkey
  • pretentious urban-lifestyle slave
  • formerly respectable bankruptcy survivor

In the novel, the interface of this technology is described as follows:

By examining those graphs in detail, Ogle could assess the emotional status of any one of the PIPER 100. But they provided more detail than Ogle could really handle during the real-time stress of a major campaign event. So Aaron had come up with a very simple, general color-coding scheme […] Red denoted fear, stress, anger, anxiety. Blue denoted negative emotions centered in higher parts of the brain: disagreement, hostility, a general lack of receptiveness. And green meant that the subject liked what they saw. (p. 372)

This immediately grabbed my attention because this is exactly what we are doing in advanced market research projects at the moment: Segmenting a population (in this case: the US electorate) in different personae that represent a larger and more important relevant part of the population under study. And a similar approach is used in innovation research, where one would also focus on “lead-users” that are ahead of their peers when it comes to the identification and experimentation with trends in their respective subject.

Quite recently, this kind of approach has surfaced in various academic publications on Twitter analysis and prediction under the name of “social sensors” (e.g. Sakaki, Okazaki and Matsuo on Twitter earthquake detection or Uddin, Amin, Le, Abdelzaher, Szymanski and Guyen on the right choice of Twitter sensors). The idea is, not to monitor the whole Twitter firehose or everything that is being posted about some hashtag (this would be the regular Social Media Monitoring approach), but to select a smaller number of Twitter accounts that have a history of delivering fast and reliable information.

3,4,5 … just how many Vs are there?

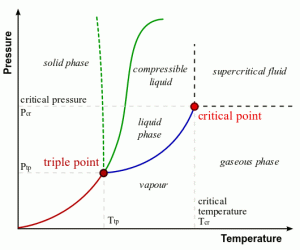
Aggretates - Solid, Liquid, Vapour.
I am confident, that BigData will harden into a solid and not get vapourised. Perhaps someday, it will reach the critical temperature and just get transparent – like so many other disrupting developments.
(Fig. CC BY-SA 3.0 by Matthieumarechal)
It took a while for the three Vs of Big data to take off as one of the most frequently quoted buzzwords of BigData. Doug Laney of Meta Group (now aquired by Gartner) had coined the in his paper on “3-D Data Management: Controlling Data Volume, Velocity and Variety” in 2001. But now, with everybody in the industry philosophing on how to characterize BigData, it is now wonder, that we start seeing many mutations in the viral spreading of Leney’s catchy definition.

Be it veracity, or volatility, or no Vs at all, many aspects of BigData are now transformed metaphorically into terms with V.

Lets just hope, nobody comes along with too much vapour that makes the bubble burst before it became mature enough. But I am confident 😉

wind map – truly beautiful data!

(blow friend to fiend: blow space to time)
—when skies are hanged and oceans drowned,
the single secret will still be man

e. e. cummings, what if a much of a which of a wind

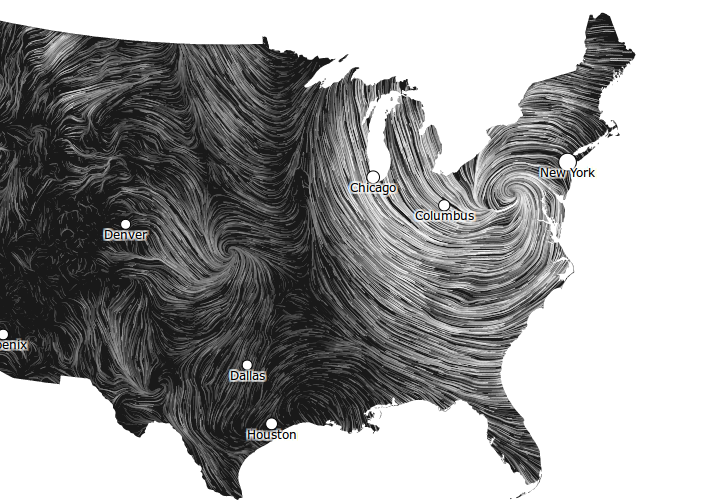
Open data is great. The National Digital Forecast Database offers free access to all the weather forecast data of the US National Weather Service. All of the US is covered with the predicted values for variables that influence the weather, like cloud cover, temperature, wind speed and direction.

Fernanda Viégas and Martin Wattenberg, two artists from Cambridge, Ma. have turned the wind forecast into a beautiful visualization. On their remarkable site http://hint.fm there are many fantastic data-viz projects, like the Flickr Flow, that give the best examples, what treasures are to be excavated from open data sources.

Not just because of hurrican Sandy, the Wind Map is one of the best cases they have on display. This is beautiful data!

10 Petabytes of Culture at Archive.org

Archive.org celebrated their crossing the mark of 10 Petabytes data stored.[1] The non-profit organisation based in San Francisco, has been following its mission to archive the Internet and provide universal access to all knowledge since 1996.

The number of 1016 might look impressive (and if we remember typical server storage capacity 10 years ago it still is, to be honest) – however the daily amount of data processed by Google alone would be exceeding more than double of that – not speaking of several hundred Petabytes of images and video stored by Facebook and Youtube. So while the achievments of Archive.org in preservation of culture are unvaluable, the task of keeping track of the daily data deluge seams out of reach, at least for the time being. To cope with mankind’s data heritage will for sure become a fascinating challenge for bigdata.

Big Data journal launches in 2013

A very clear indicator that a topic is not only an ephemeral hype is when there will be a scientific journal for this new topic. This has just happened with Big Data as Liebert publishers just announced at the Strata conference the launch of their peer-reviewed journal “Big Data” for 2013. It will be edited by O’Reilly’s Edd Dumbill.

But you don’t have to wait until the next year, but can already grab a special preview issue featuring five original articles for download right now.

All peer-reviewed articles will be published under a Creative Commons licence and therefore be available for free when they will be published.

TechAmerica publishes “Big Data – A practical guide to transforming the business of government”

Earlier this month, the TechAmerica foundation has published their comprehensive reader “Demystifying Big Data: A Practical Guide To Transforming The Business of Government”.

Lobbying politicians to follow the Big Data path and support the industry by issuing the necessary changes in education and research infrastructure is a just and also obvious goal of the text. Nevertheless, the publication offers quite some interesting information on Big Data in general and its application in the pubic sector in particular.

It is also a good introduction into the field. Defining not only the notorious “Three Vs” volume, velocity, variety that we are used to characterize Big Data with, but adding a forth V: Veracity – the quality and provenance of received data. Because of the great progress in error and fraud detection, outlier handling, sensitivity analysis, etc. we tend to neglect the fact, that still data-based decisions require traceability and justification – with those huge heaps of data very well more then ever.

To encourace every federal agency “to follow the FCC’s decision to name a Chief Data Officer” is one of the sensible conclusions of the text.

In the future we won’t be advertising to humans any more.

The future of advertising after Siri – or: posthuman advertising.
by Benedikt Koehler and Joerg Blumtritt

The Skynet Funding Bill is passed. The system goes on-line August 4th, 1997. Human decisions are removed from strategic defense. Skynet begins to learn at a geometric rate. It becomes self-aware at 2:14 a.m. Eastern time. (Terminator 2: Judgment Day, 1991)

The advent of computers, and the subsequent accumulation of incalculable data has given rise to a new system of memory and thought parallel to your own. Humanity has underestimated the consequences of computerization. (Ghost in the Shell, 1996)

Are you a sentient being? – Who cares whether or not I am a sentient being. (ELIZA, 1966)

“Throughout human history, we have been dependent on machines to survive.” This famous punch-line from “The Matrix” summarizes what Canadian media philosopher Herbert Marshall McLuhan had brought to the mind of his time: Our technology as our culture cannot be separated from our physical nature. Technology is an extension of our body. Quite commonly quoted are his examples of wheels being an extension of our feet, clothes of our skin, or the microscope of our eyes. Consequently, McLuhan postulated, that electronic media would become extensions to our nervous system, our senses, our brain.

Advertising as we know it

Advertising means deliberately reaching consumers with messages. We as advertisers are used to sending an ad to be received through the senses of our “target group”. We chose adequate media – the word literally meaning “middle” or “means” – to increase the likelihood of our message to be viewed, read or listened to. After our targets would have been contacted in that way, we hope, that by a process called advertising psychology, their attitudes and finally actions would be changed in our favor – giving consumers a “reason why” they should purchase our products or services.

The whole process of advertising is obviously rather cumbersome and based on many contingencies. In fact, although hardly anyone would disagree in consumption as a necessary or even entertaining part of their lives, almost everyone is tired of the “data smog” as David Shenk calls it receiving between 5,000 and 15,000 advertising messages every day. Diminishing effectiveness and rising inefficiency is the consequence of our mature mass markets, cluttered with competing brands. Ad campaigns fighting for our attention ever more often can be experienced as SPAM. To get through, you have to out-shout the others, to be just more visible, more present in your target group’s life. The Medium is the Massage” as McLuhan himself twisted his own famous saying.

Enter Siri

When Apple launched the iPhone 4s, the OS had incorporated a peculiar piece of software, bearing the poetical name Siri (the Valkyrie of victory). At first sight, Siri just appears to be some versatile interface that allows controlling the device in a way much closer to natural communication. Siri has legendary ancestors, stemming from DARPA’s cognitive agents program. Software agents have been around for some time. Normally we experience them as recommendation engines in shop systems such as Amazon or Ebay, offering us items the agent would guess fitting our preferences by analyzing our previous behavior.

Such preference algorithms are part of a larger software and database concept, usually called agents or daemons in the UNIX context. Although there is no general definition, agents should to a certain extent be self-adapting to their environment and its changes, be able to react to real world or data events and interact with users. Thus agents may seem somewhat autonomous. Some fulfill monitoring or surveillance tasks, triggering actions after some constellation of inputs occurs, some are made for data mining, to recognize patterns in data, others predict users’ preferences and behavior such as shopping recommendation systems.

Siri is apparently a rather sophisticated personal agent that is monitoring not only the behavior on the phone but also many other data sources available through the device. You might e.g. tell Siri : “call me a cab!” – and the phone will autodial to the local taxi operator. Ever more often, people can be watched, standing at the corner, of some street muttering in their phones: “Siri, where am I?” And Siri will dutifully answer, deploying the phone’s GPS data.

Our personal Agents

Agents like Siri are creating a form of representation of ourselves data-wise. These representations – we might also call them ‘avatars’ – are not arbitrarily shaped like the avatars we might take in playing multiuser games like World of Warcraft. It is not us willingly giving them shape but it is algorithms taking what information they might get about us to project us into their data-space. This is similar what big data companies like Google or Facebook do by collecting and analyzing our search inputs, our surfing behavior or our social graph. But in the case of personal agents, the image that is created from our data is kept in cohesion, stays somehow material, becoming even personally addressable. Thus these avatars become more and more simulacra of ourselves, projections of our bodily life into the data-sphere.

We hope the reader notices the fundamental difference between algorithms, predicting something about us from some date collected about us or generalized from others’ behavior like we find with advertising targeting or retail recommendations. In the case of our avatar, we really take the agent as a second skin, made from data.

And suddenly, advertising is no longer necessary to promote goods. Our avatar is notified of offerings and made proposals for sales. It can autonomously decide what it would find relevant or appropriate, just the way Google would decide in our place what web-page to rank higher or lower in our search results. Instead of getting our bodily senses’ attention for the ad’s message, the advertiser has now to fulfill the new task of persuading our avatar’s algorithms of the benefits of the good to be advertised for.

Instead of using advertising psychology, the science of getting into someone’s minds by using rhetoric, creation, media placements etc., will advertising will be hacking into our avatars’ algorithms. This will be very similar to today’s search engine optimization. Promoting new goods would be trying to get into the high ranks of as many avatars’ preferences as possible. Of course, continuous business would only be sustained, if the product would be judged satisfying by our avatar when taken into consideration.

A second skin

But why stop at retail? Our avataric agents will be doing much more for us – for the better or the worse. Apart from residual bursts of spontaneity that might lead us to do things at will – irrationally – our avatars could take over to organizing our day to day lives, make appointments for us, and navigate us through our business. It would pre-schedule dates for meetings with our peers according to our preferences and the contents of our communication it continuously monitors.

You could imagine our data-skin as some invisible aura, hovering around our physical body in an extra dimension. Like a telepathic extension of our senses, the avatars would make us aware of things not immediately present – like someone trying to reach out to us or something that would have to be done now. And although this might sound at first spooky, we are in fact not very far from these experiences: our social media timeline, the things we recognize in the posts of our friends and other people, we follow on Facebook, Twitter or Google+ already tend to connect us to others in a continuous and non-physical way. Just think of this combined with our personal assistants – like the calendars and notices we keep on our devices – and with the already quite advanced shop-agents on Amazon and other retailers – and we have arrived in an post-human age of advertising. This only requires one thing to be built before our avatar is complete: we need standardized APIs, interfaces that would suck the data of various sources into our avatar’s database. Thus every one of us would become a data kraken of our own. And this might be, what ‘post privacy’ is finally all about

Strata Conference – the first day

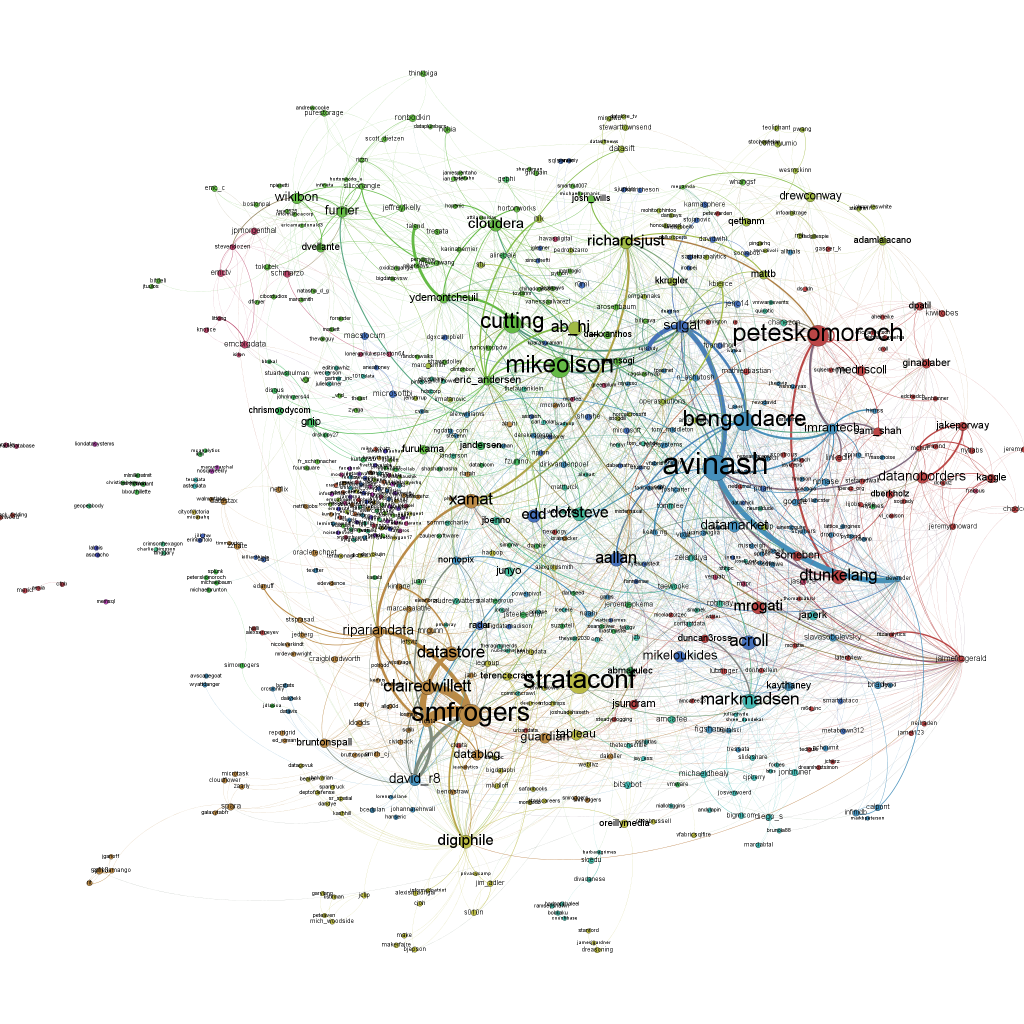
Here’s a network visualization of all tweets referring to the hashtag “#strataconf” (click to enlarge). The node size is representing the number of incoming links, i.e. the number of times this person has been mentioned in other people’s tweets:

This network map has been generated in three steps:

1) Data collection: I collected the twitter data with the open source application YourTwapperKeeper. This is the DIY version of the TwapperKeeper platform that had been very popular in the scientific community. Unfortunately after the acquisition by HootSuite it is no longer available to the general public, but John O’Brien has made the scripts available via his githup. I am running yTK on a Amazon EC2 instance. What it does is connecting to the Twitter Streaming API and fetching all tweets with “#strataconf” in realtime and additionally doing regular searches via the Search API to find tweets that had been overlooked by the Streaming API.

2) Data processing: What is so great about yTK: It offers different methods to fetch the tweets you collected. I am using the JSON API to get the tweets downloaded to my computer. This is done with a Python script. The script opens the JSON file and then scans the tweets for mentions or retweets with the following regular expressions I borrowed from Matthew Russell’s book Mining the Social Web:

rt_patterns = re.compile(r"(RT|via)((?:\b\W*@\w+)+)", re.IGNORECASE)
at_pattern = re.compile(r"@(\w+)", re.IGNORECASE)

Then I am using the very convenient library igraph to write the results in the generic graphml file format that can be processed by various network analysis tools. Basically I am just using this snipped of code on all tweets I found to generate the list of nodes:

if not tweet['from_user'].lower() in nodes:
    nodes.append(tweet['from_user'].lower())

… and edges:

for mention in at_pattern.findall(tweet['text']):
    mentioned.append(mention.lower())
    if not mention.lower() in nodes:
        nodes.append(mention.lower())
    edges.append((nodes.index(tweet['from_user'].lower()),nodes.index(mention.lower())))

The graph is generated with the following lines of code:

g = Graph(len(nodes), directed=True)
g.vs["label"] = nodes
g.add_edges(edges)

This is almost the whole code for processing the network data.

3) Visualization: The visualization of the graph is done with the wonderful cross-platform tool Gephi. To generate the graph above, I reduced the network to all nodes that have at least one other node referring to it. Then I sized the nodes according to their total number of degrees, that is how often they were mentioned in other people’s tweets or how often they were mentioning other users. The color is determined by the modularity clustering algorithm. Then I used the Force Atlas layout algorithm and voilà – here’s the network map.

10 hot big data startups to watch this year

[Here’s the update for 2013]

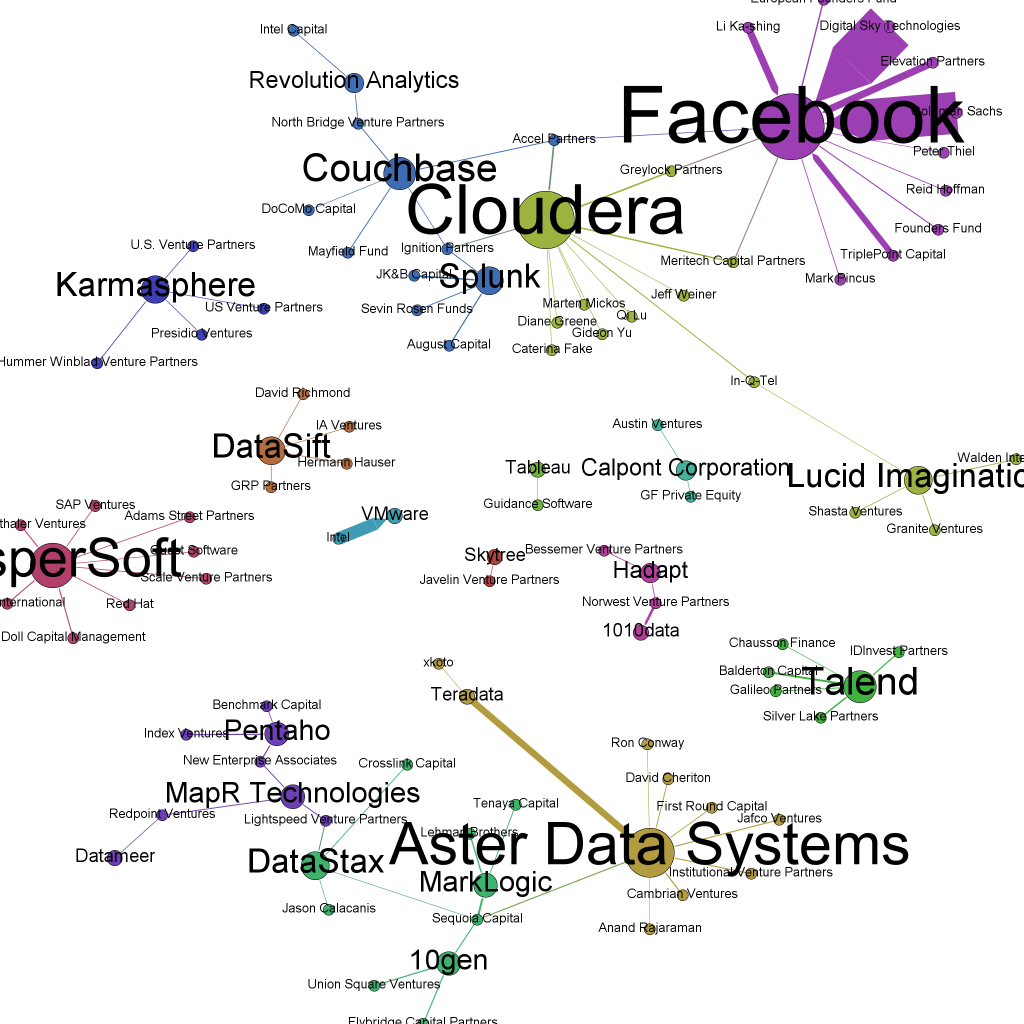
Everybody knows Cloudera, MapR, Splunk, 10Gen and Hortonworks. But what about Platfora or Hadapt? These 10 startups are my bet on which big data companies will probably be game-changers in 2012:

Platfora aims at providing a “revolutionary BI and analytics platform that democratizes and simplifies the use of big data and Hadoop”. From what the website tells about Platfora approach, it is all about transforming Hadoop datasets into enterprise dashboards with multidimensional layouts, drill-down possibilities and predictive analytics and to generate big data insights. The founder, Ben Werther, had been product head at the data analytics company Greenplum before and Platfora VP Marketing hails from Solera, a company specialized in network forensic solutions. In September, they received $7.2M in Series A funding by Andreessen Horovitz, In-Q-Tel and Sutter Hill. In-Q-Tel is a company identifying and investing in solutions that could be valuable for the US intelligence community and especially the CIA.
Valley based SumoLogic tackles one of the central big data problems: log file analysis. With the help of their technologies Elastic Log Processing™ and LogReduce™, they claim to provide next generation logfile analysis on a petabyte scale. Co-founder and CEO Kumar Saurabh had been data architect at mint.com before. The company received $15M in January 2012 by Sutter Hill, Greylock Partners and Shlomo Kramer. SumoLogic left stealth mode only a few days ago, so try it while it is still fresh.

Hadapt is one of the few big data companies from the east-coast. Its USP seems to be the combination of the two elements of Hadoop and RDBMS. Their approach of combining SQL queries and Hadoop’s cluster processing claims to deliver significant performance gains over standalone Hadoop systems (Hive/HDFS). CEO Justin Borgmann had worked as product developer at the anti-counterfeit company COVECTRA before founding Hadapt. The product is now in closed beta mode. It reecived $9.5M of funding by Norwest and Bessemer in October 2011.

Continuuity is currently in stealth-mode, but the impressive names – Andreessen Horowitz, Battery and Ignitions – behind the first funding round of $2.5M sound very promising. The founder and CEO, Jonathan Gray, worked for a personalized news site before. Unfortunately, that’s all that can be said about this very covert start-up right now.

Kontagent is a bit older and already offers a product. This San Francisco based company has already received $17.5M in funding. While not a big data company per se, what Kontagent is doing is a big data challenge par excellence: tracking 15,000 clicks and messages a second sent from over 1,000 social and mobile applications. Their solution kSuite provides application developers and marketers with advanced analytical and visualization features.

Domo claims to provide a new form of business intelligence providing an SaaS executive management dashboard accessible by all kinds of devices. It has received $63M of funding by investors such as IVP and Benchmark. Its founder and CEO, Josh James, had been previously known for founding data analytics company Omniture. This seems to be one of Domo’s strongest asset. Right now, Domo is accepting first users in their early-adopter program.

Metamarkets is all about detecting patterns and changes in large data flows such as transactions, traffic or social events. But the San Francisco-based startup not only identifies changes, but offers predictive analytics that can forecast future traffic or demands. Founder David Soloff had previously been Director Information Products at the media management software company Rapt that had been acquired by Microsoft in 2008. Metamarkets have received $8.5M of funding in two rounds so far. And they have a beautiful dashboard.

DataStax (formerly known as Riptano) is one of the companies that are growing in the Big Data ecosystem by delivering consulting, support and training for software solutions such as Cassandra in this case. Up to know, they have secured $13.7M of funding by the like of Sequoia Capital and Lightspeed.

Odiago should also be considered a hot startup. Its founder, Christophe Bisciglia, had previously founded Cloudera after leaving Google where he had been a Senior Software engineer. Right now, Odiago’s first product, wibidata, is in beta stage: a software solution including Hadoop, HBase and Avro for managing and analyzing large sets of userdata, structured or unstructured.

Cupertino based Karmasphere is another Big Data meets Business Intelligence solution startup we should watch. They received another $6M of funding last year, making it $11M in total. They have a variety of products out, including a Amazon AWS based cloud analytics solution.

Big Data and the end of the middle management

Big data as substitution for people? That sounds like a cyberneticist’s daydream to you? Michael Rappa, Director of the Institute for Advanced Analytics at the North Carolina State University does not think so. In this FORBES interview, he explains the advantages of a “data-driven corporate culture”:

“Data has a potentially objective quality. It accelerates consensus,” said Rappa. “If you feel that you can trust your data scientists and the models they build, if your team can buy into a culture that values data, the grey areas that open the door to political infighting disappear.”

Actually, I don’t buy this. Data (and especially data visualizations) certainly have a kind of objective aura. They seem to just be there. The whole micropolitical process that went into defining measures, indicators and algorithms is hidden behind this objective aura of (big) numbers. But where there were fights about corporate strategy, tactics and processes, there will also be data-based fights about these things – although maybe a bit nerdier and more esoteric and difficult for the rest of the management to understand.

A more pessimistic view is proposed by the Columbia Journalism Review: Here data-based decision-making (aka “clickocracy”) is seen as a threat to journalistic quality because journalists will start to optimize their own writing the minute they feel they are monitored in a big data clickstream:

[A]udiences now provide feedback unintentionally through online metrics (the running tally of which articles get clicked on the most). Reporters—who fear that a lack of clicks could cost them their jobs—watch these tallies, as do editors and publishers, because higher metrics mean higher online ad revenues.

Telling stories with network data: Instagram in China

One of the most interesting sources of social media data right now is the iPhone based image sharing platform Instagram. This social networking platform is based on images, which can be compared with Flickr, but with Instagram the global dimension is much more visible. And because of the seamless Twitter and Facebook integration, the networking component is stronger. And it has a great API 😉

The first thing that came to my mind when looking at the many options, the API is providing to developers, has been the tags. In the Instagram application, there is no separate field for tagging your (or other peoples’) images. Instead you would write it in the comment field as you would do in Twitter. But the API allows to fetch data by hashtags. After reading this fascinating article (and looking at the great images) in Monocle about the northern Chinese city of Harbin, I wanted to learn more about the visual representation of this city in Instagram.

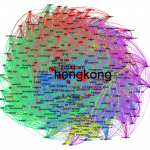
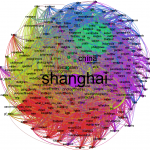
What I did was the following: I wrote a short Python program that fetched the 1.000 most recently posted images for any hashtag. As I could not get the two available Instagram Python modules to work properly, I wrote my own interface to Instagram based on pycurl. The data is then transformed into a network based on the co-occurence of hashtags for the images and saved in GraphML format with the Python module igraph. Other data (such as filters, users, locations etc.) that can be evaluated is saved in separate data sets. Here’s the network visualizations for China, Shanghai, Beijing, Hongkong, Shenzen and Harbin – not the whole network, but a reduced version only with the tags that were mentioned at least five times (click to enlarge):

I also calculated some interesting indicators for the six hashtags I explored:

The first thing to notice is that Harbin obviously is not as often being instagrammed as the Shanghai, Shenzhen, Hongkong or Beijing. An interesting indicator here is in the second data column: the daily number of images tagged with this location. Shenzhen seems to be the most active city with 3.4 images tagged “#shenzen”. Beijing is almost as active, while Shanghai is a bit behind. Finally, for Harbin, there’s not even one image every day. The unique tags is showing the diversity of hashtags used to describe images. Here, China is clearly in the lead. The next two indicators tell something about the connections between the tags: The density is calculated as the relation of actual to possible edges between the network nodes. Here, the smaller network of Harbin has the highest density and China and Shanghai the lowest. The average path length is a little below 2 for all hashtags.

Now, let’s take a look at the most frequently used hashtags:

What is interesting here: Harbin clearly does tell a story about snow, cold weather and a ice sculpture park, while Shanghai seems to be home for users frequently tagging themselves to advertise their instagramming skills (I marked the tags that refer to usernames with an asterisk). Most of the frequently used hashtags are Instagram lingo (instagood, instagram, ig, igers, instamood), refer to the equipment (iphonesia, iphoneography) or the region (china). Topical hashtags, that tell something about the city or the community can seldom be found in the top hashtags. Nonetheless, they are there. Here’s a selection of hashtags telling a story about the cities:

Finally, here is the most frequently liked image for each of the hashtags – to remind us that the numbers and networks only tell half the story. Enjoy and see if you can spot the ice sculptures in Harbin!

China:

Shanghai:

Beijing:

Hongkong:

Shenzhen:

Harbin: