Algorithm Ethics

An algorithm is a structured description on how to calculate things. Some of the most prominent examples of algorithms have been around for more than 2500 years like Euklid’s algorithm that gives you the greatest common divisor or Erathostenes’ sieve to give you all prime numbers up to a given maximum. These two algorithms do not contain any kind of value judgement. If I define a new method for selecting prime numbers – and many of those have been publicized! – every algorithm will come to the same solution. A number is prime or not.

But there is a different kind of algorithmic processes, that is far more common in our daily life. These are algorithms that have been chosen to find a solution to some task, that others would probably have done in a different way. Although obvious value judgments done by calculation like credit scoring and rating immediately come to our mind, when we think about ethics in the context of calculations. However there is a multitude of “hidden” ethic algorithms that far more pervasive.

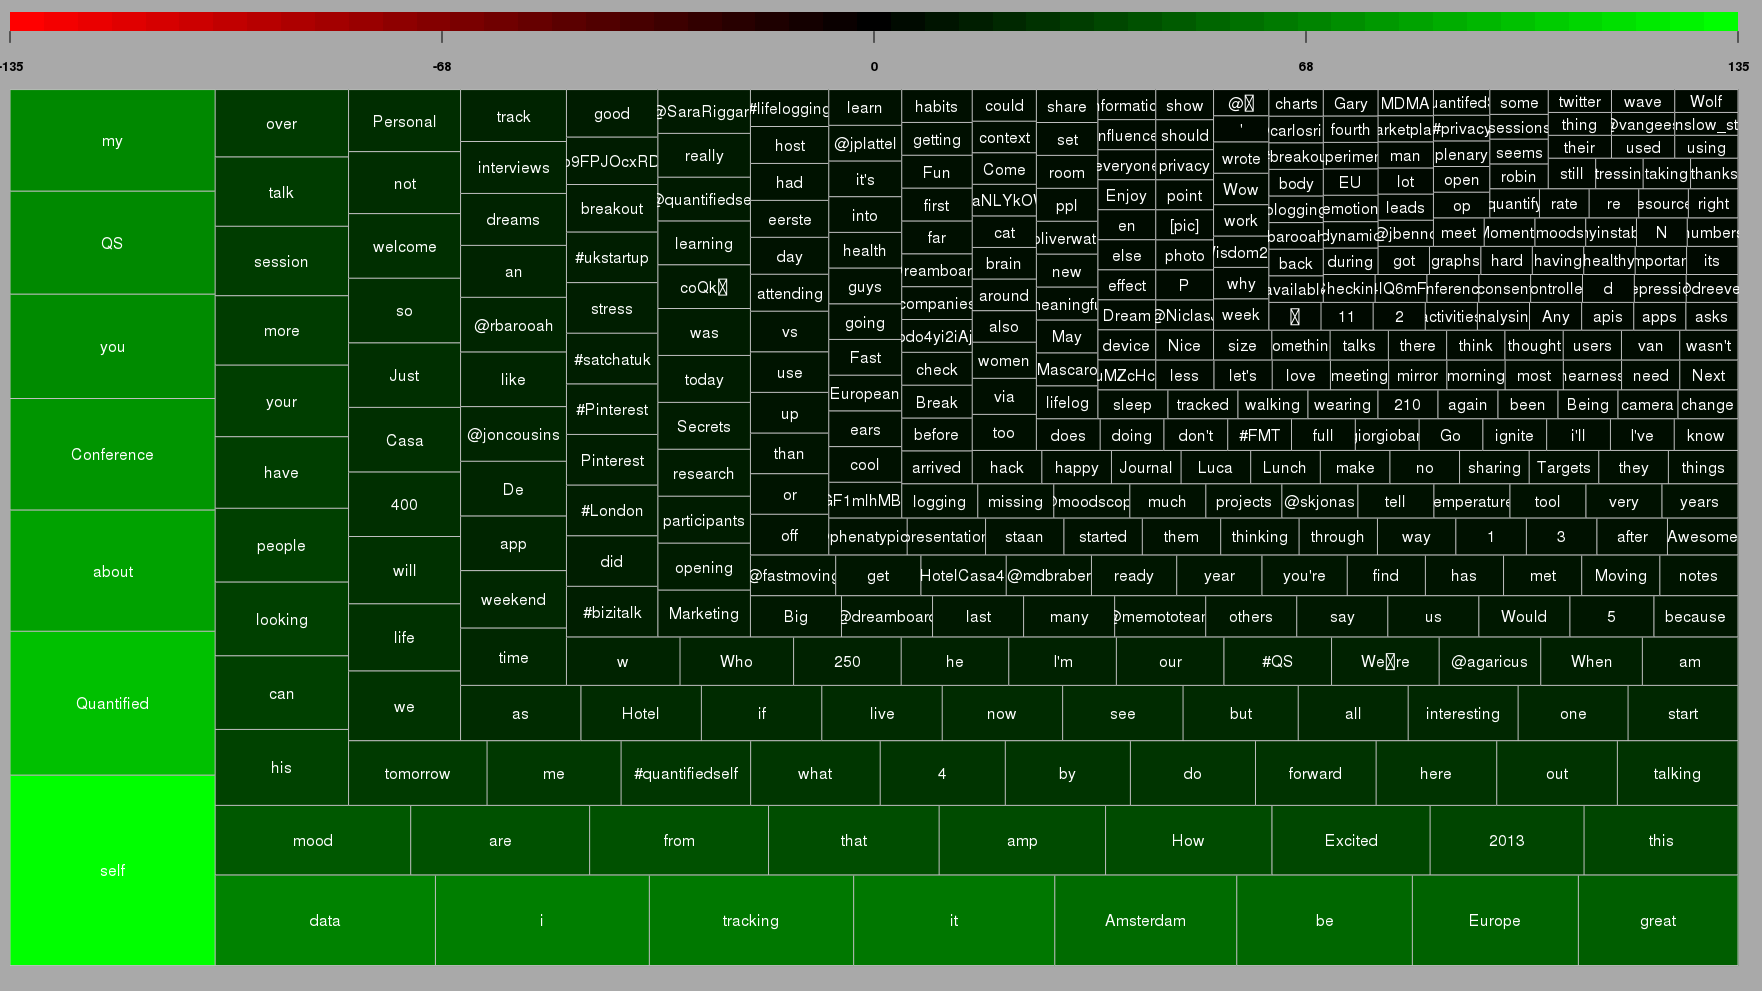
On example that I encountered was given by Gary Wolf on the Quantified Self Conference in Amsterdam. Wolf told of his experiment in taking different step-counting gadgets and analyzing the differing results. His conclusion: there is no common concept of what is defined as “a step”. And he is right. The developers of the different gadgets have arbitrarily chosen one or another method to map the data collected by the gadgets’ gyroscopic sensors into distinct steps to be counted.

So the first value judgment comes with choosing a method.

Many applications we use work on a fixed set of parameters – like the preselection of a mobile optimized CSS when the web server encounters what it takes for a mobile browser. Often we get the choice to switch to the “Web-mode”, but still there are many sites that would not allow our changing the view unless we trick the server into believing that our browser would be a “PC-version” and not mobile. This of course is a very simple example but the case should be clear: someone set a parameter without asking for our opinion.

The second way of having to deal with ethics is the setting of parameters.

A good example is given by Kraemer et. al in their paper. In medical imaging technologies like MRI, an image is calculated from data like tiny elecromagnetic distortions. Most doctors (I asked some explicitly) take these images as such (like they have taken photographs without much bothering about the underlying technology before). However, there are many parameters, that the developers of such an algorithmic imaging technology have predefined and that will effect the outcome in an important way. If a blood vessel is already clotted by arteriosclerosis or can be regarded still as healthy is a typical decision where we would like be on the safe side and thus tend to underestimate the volume of the vessel, i.e. prefer a more blurry image, while when a surgeon plans her cut, she might ask for a very sharp image that overestimates the vessel’s volume by trend.

The third value judgment is – as this illustrates – how to deal with uncertainty and misclassification.

This is what we call alpha and beta errors. Most people (especially in business context) concentrate on the alpha error, that is to minimize false positives. But when we take the cost of a misjudgement into account, the false negative often is much more expensive. Employers e.g. tend to look for “the perfect” candidate and by trend turn down applications that raise their doubts. By doing so, it is obvious that they will miss many opportunities for the best hire. The cost to fire someone that was hired under false expectations is far less than the cost of not having the chance in learning about someone at all – who might have been the hidden beauty.

The problem of the two types of errors is, you can’t optimize both simultaneously. So we have to make a decision. This is always a value judgment, always ethical.

With drones prepared for autonomous kill decisions this discussion becomes existential.

All three judgments – What method? What parameters? How to deal with misclassification? – are more often than not made implicitly. For many applications, the only way to understand these presumptions is to “open the black box” – hence to hack.

Given all that, I would like to demand three points of action:
– to the developers: you have to keep as many options open as possible and give others a chance in changing the presets (and customers: you must insist of this, when you order the programming of applications);
– to the educational systems: teach people to hack, to become curious about seeing behind things.
– to our legislative bodies: make hacking things legal. Don’t let copyright, DRM and the like being used against people who re-engineer things. Only what gets hacked, gets tested. Let us have sovereignty over the things we have to deal with, let us shape our surroundings according to our ethics.

Notes

My slides on this topic:

At the last re:pubica conference I gave a talk and hosted a discussion on “Algorithm ethics” that was recorded. (in German):

The Quantified Self

The most common words in the Tweets tagged #qseu13 posted over the weekend.
The most common words in the Tweets tagged #qseu13 posted over the weekend. Here you find another visualization: [Wordcloud]
Last weekend the 4th Conference on Quantified Self took place in Amsterdam. Quantified Self is a movement or direction of thought that summarizes many aspects of datarization of the live of people by themselves. The term “QS” was coined by Kevin Kelly and Gary Wolf, who hosted the conference. Thus it cannot be denied that some roots of QS lie in the Bay-Area techno-optimistic libertarianism best represented by Wired. However a second root stems from people who started quantifying themselves to better deal with manifest health problems – be it polar disorder, insomnia or even Parkinson and cancer. In both aspects the own self acts as object and subject to first analyze and then shape itself. Both have to do with self-empowerment and acting on our human condition.

“For Quantified Self, ‘big data’ is more ‘near data’, data that surrounds us.”
Gary Wolf

Quantified Self can be viewed as taking action to reclaim the collection of personal data, not because of privacy but because of curiosity. Why not take the same approach that made Google, Amazon and the like so successful and use big data on yourself?

Tweets per hour during the conference weekend. Of course our physical life finds its expression in data ....
Tweets per hour during the conference weekend. Of course our physical life finds its expression in data ….
Since many QS-people use off-the-shelf gadgets, it is not only important to get full access to the data collected but also transparency on the algorithms that are implemented within. Like Gary Wolf pointed out, if two step-counters vary in their results, it tells us one thing: there is no common concept of ‘What is a step?’. These questions of algorithm ethics become more pressing as our daily life becomes more and more dependent on algorithms but we would usually not have a chance to see into that “black box” and the implicit value judgements that are programmed into it. (I just gave a talk on that specific topic at re:publica last Monday which I will post here later). I think that in no field the problems of algorithms taking ethic decisions becomes more obvious than when data deals immediately with yourself.

What self is there to be quantified?

What is the “me”? What is left, when we deconstruct what we are used to regard as “our self” into quanta? Is there a ghost in the shell? The idea of self-quantification implies an objective self that can be measured. With QS, the rather abstract outcomes of neuroscience or human genetics become tangible. The more we have quantitatively deconstructed us, the less is left for mind/body-dualism.

On est obligé d’ailleurs de confesser que la Perception et ce qui en dépend, est inexplicable par des raisons mécaniques.
G. W. Leibniz

As a Catholic, I was never fond that our Conscious Mind would just be a Mechanical Turk. As a mathematician, I feel deep satisfaction in seeing our world including my very own self becoming datarizable – Pythagoras was right, after all! This dialectic deconstruction of suspicious dualism and materialistic reductionism was discussed in three sessions I attended – Whitney Boesel’s “The missing trackers”, Sarah Watson’s “The self in data” and Natasha Schüll’s “Algorithmic Selfhood”.

“Quantifying yourself is like art: constructing a kind of expression.”
Robin Barooah

Many projects I saw at #qseu13 can be classified as art projects in their effort to find the right language to express the usually unexpresseble. But compared to most “classic” artists I know, the QS-apologetes are far less self-centered (sounds more contradictory than it is) and much more directed to in changing things by using data to find the sweetspot to set their levers.

What starts with counting your steps ends consequently in shaping yourself with technological means. Enhancing your bodily life with technology is the definition of becoming a Cyborg, as my friend Enno Park points out. Enno got Cochlea-implants to overcome his deafness. He now advocates for Cyborg rights – starting with his right to hack into his implants. Enno demands his right to tweak the technology that became part of his head.

Self-hacking will become as common as taking Aspirin to cure a headache. Even more: we will have to get literate in the quantification techniques to keep up with others that would anyway do it for us: biometric security systems, medical imaging and auto-diagnosis. To express ourselves with our data will become part of our communication culture as Social Media have today. So there will be not much of an alternative left for those who have doubts about quantifying themself. “The cost of abstention will drive people to QS.” as Whitney Boesel mentioned.

Top Twitterers for #qseu13-conference: 1) Whitney Erin Boesel, 2) Maneesh Juneja 3) that's me ;)
Top Twitterers for #qseu13-conference: 1) Whitney Erin Boesel, 2) Maneesh Juneja 3) that’s me 😉

Color analysis of Flickr images

Since I’ve seen this beautiful color wheel visualizing the colors of Flickr images, I’ve been fascinated with large scale automated image analysis. At the German Market Research association’s conference in late April, I presented some analyses that went in the same direction (click to enlarge):

Color values of Flickr images from Germany

On the image above you can see the color values ordered by their hue from images taken in Germany between August 2010 and April 2013. Each row represents the aggregation of 2.000 images downloaded from the Flickr API. I did this with the following R code:

bbox <- "5.866240,47.270210,15.042050,55.058140"
pages <- 10
maxdate <- "2010-08-31"
mindate <- "2010-08-01"
 
for (i in 1:pages) {
api <- paste("http://www.flickr.com/services/rest/?method=flickr.photos.search&format=json&api_key=YOUR_API_KEY_HERE &nojsoncallback=1&page=", i, "&per_page=500&bbox=", bbox, "&min_taken_date=", mindate, "&max_taken_date=", maxdate, sep="")
raw_data <- getURL(api, ssl.verifypeer = FALSE)

data <- fromJSON(raw_data, unexpected.escape="skip", method="R")
# This gives a list of the photo URLs including the information
# about id, farm, server, secret that is needed to download
# them from staticflickr.com
}

To aggregate the color values, I used Vijay Pandurangans Python script he wrote to analyze the color values of Indian movie posters. Fortunately, he open sourced the code and uploaded it on GitHub (thanks, Vijay!)

The monthly analysis of Flickr colors clearly hints at seasonal trends, e.g. the long and cold winter of 2012/2013 can be seen in the last few rows of the image. Also, the soft winter of 2011/2012 with only one very cold February appears in the image.

To take the analysis even further, I used weather data from the repository of the German weather service and plotted the temperatures for the same time frame:

Temperature in Germany

Could this be the same seasonality? To find out how the image color values above and the temperature curve below are related, I calculated the correlation between the dominance of the colors and the average temperature. Each month can not only be represented as a hue band, but also as a distribution of colors, e.g. the August 2010 looks like this:

So there’s a percent value for each color and each month. When I correlated the temperature values and the color values, the colors with the highest correlations were green (positive) and grey (negative). So, the more green is in a color band, the higher the average temperature in this month. This is how the correlation looks like:

Temperature and color values

The model actually is pretty good:

> fit <- lm(temp~yellow, weather)
> summary(fit)
Call:
lm(formula = temp ~ yellow, data = weather)
Residuals:
Min 1Q Median 3Q Max
-5.3300 -1.7373 -0.3406 1.9602 6.1974

Coefficients:
Estimate Std. Error t value Pr(>|t|)
(Intercept) -5.3832 1.2060 -4.464 0.000105 ***
yellow 2.9310 0.2373 12.353 2.7e-13 ***
---
Signif. codes: 0 '***' 0.001 '**' 0.01 '*' 0.05 '.' 0.1 ' ' 1
Residual standard error: 2.802 on 30 degrees of freedom
Multiple R-squared: 0.8357, Adjusted R-squared: 0.8302
F-statistic: 152.6 on 1 and 30 DF, p-value: 2.695e-13

Of course, it can even be improved a bit by calculating it with a polynomial formula. With second order polynomials lm(temp~poly(yellow,2), weather), we even get a R-squared value of 0.89. So, even when the pictures I analysed are not always taken outside, there seems to be a strong relationship between the colors in our Flickr photostreams and the temperature outside.