Today, the Twitter engineering team released another very interesting Open Source R package for working with time series data: “AnomalyDetection“. This package uses the Seasonal Hybrid ESD (S-H-ESD) algorithm to identify local anomalies (= variations inside seasonal patterns) and global anomalies (= variations that cannot be explained with seasonal patterns).
As a kind of warm up and practical exploration of the new package, here’s a short example on how to download Wikipedia PageView statistics and mine them for anomalies (inspired by this blog post, where this package wasn’t available yet):
First, we install and load the necessary packages:
library(RJSONIO)
library(RCurl)
library(ggplot2)
install.packages("devtools")
devtools::install_github("twitter/AnomalyDetection")
library(AnomalyDetection)
Then we choose an interesting Wikipedia page and download the last 90 days of PageView statistics:
page <- "USA"
raw_data <- getURL(paste("http://stats.grok.se/json/en/latest90/", page, sep=""))
data <- fromJSON(raw_data)
views <- data.frame(timestamp=paste(names(data$daily_views), " 12:00:00", sep=""), stringsAsFactors=F)
views$count <- data$daily_views
views$timestamp <- as.POSIXlt(views$timestamp) # Transform to POSIX datetime
views <- views[order(views$timestamp),]
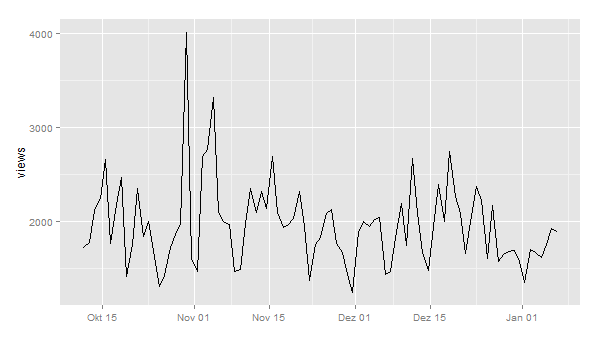
I also did some pre-processing and transformation of the dates in POSIX datetime format. A first plot shows this pattern:
ggplot(views, aes(timestamp, count)) + geom_line() + scale_x_datetime() + xlab("") + ylab("views")

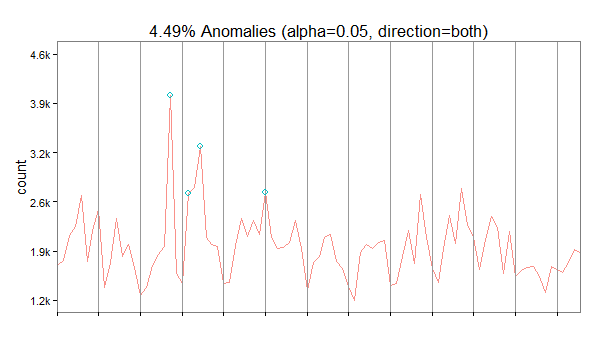
Now, let’s look for anomalies. The usual way would be to feed a dataframe with a date-time and a value column into the AnomalyDetection function AnomalyDetectionTs(). But in this case, this doesn’t work because our data is much too coarse. It doesn’t seem to work with data on days. So, we use the more generic function AnomalyDetectionVec() that just needs the values and some definition of a period. In this case, the period is 7 (= 7 days for one week):
res = AnomalyDetectionVec(views$count, max_anoms=0.05, direction='both', plot=TRUE, period=7)
res$plot

In our case, the algorithm has discovered 4 anomalies. The first on October 30 2014 being an exceptionally high value overall, the second is a very high Sunday, the third a high value overall and the forth a high Saturday (normally, this day is also quite weak).

Sooo-cool!
If you want to do this with more time points though, use the wikipediatrend package for convenience access statistics directly downloaded into your R-session. See also [here] for a quick introduction to package use.
Thanks Peter for your handy package.
Combined with Benedikt original post I was able to detect anomalies on Marie Currie’s Wikipedia page.
Thanks both of you.
This is cool! I’m just getting into time-series concepts and these packages look promising, but how does this type of analysis differ from methods used to find global and local maxima/minima? For example, like the one implemented in pastec’s turnpoints() function?
Interesting review! But how can I render some date labels on x axis?