How to analyze smartphone sensor data with R and the BreakoutDetection package

Yesterday, Jörg has written a blog post on Data Storytelling with Smartphone sensor data. Here’s a practical approach on how to analyze smartphone sensor data with R. In this example I will be using the accelerometer smartphone data that Datarella provided in its Data Fiction competition. The dataset shows the acceleration along the three axes of the smartphone:

  • x – sideways acceleration of the device
  • y – forward and backward acceleration of the device
  • z – acceleration up and down

The interpretation of these values can be quite tricky because on the one hand there are manufacturer, device and sensor specific variations and artifacts. On the other hand, all acceleration is measured relative to the sensor orientation of the device. So, for example, the activity of taking the smartphone out of your pocket and reading a tweet can look the following way:

  • y acceleration – the smartphone had been in the pocket top down and is now taken out of the pocket
  • z and y acceleration – turning the smartphone so that is horizontal
  • x acceleration – moving the smartphone from the left to the middle of your body
  • z acceleration – lifting the smartphone so you can read the fine print of the tweet

And third, there is gravity influencing all the movements.

So, to find out what you are really doing with your smartphone can be quite challenging. In this blog post, I will show how to do one small task – identifying breakpoints in the dataset. As a nice side effect, I use this opportunity to introduce an application of the Twitter BreakoutDetection Open Source library (see Github) that can be used for Behavioral Change Point analysis.

First, I load the dataset and take a look at it:

setwd("~/Documents/Datarella")
accel <- read.csv("SensorAccelerometer.csv", stringsAsFactors=F)
head(accel)

  user_id           x          y        z                 updated_at                 type
1      88 -0.06703765 0.05746084 9.615114 2014-05-09 17:56:21.552521 Probe::Accelerometer
2      88 -0.05746084 0.10534488 9.576807 2014-05-09 17:56:22.139066 Probe::Accelerometer
3      88 -0.04788403 0.03830723 9.605537 2014-05-09 17:56:22.754616 Probe::Accelerometer
4      88 -0.01915361 0.04788403 9.567230 2014-05-09 17:56:23.372244 Probe::Accelerometer
5      88 -0.06703765 0.08619126 9.615114 2014-05-09 17:56:23.977817 Probe::Accelerometer
6      88 -0.04788403 0.07661445 9.595961  2014-05-09 17:56:24.53004 Probe::Accelerometer

This is the sensor data for one user on one day:

accel$day <- substr(accel$updated_at, 1, 10)
df <- accel[accel$day == '2014-05-12' & accel$user_id == 88,]
df$timestamp <- as.POSIXlt(df$updated_at) # Transform to POSIX datetime
library(ggplot2)
ggplot(df) + geom_line(aes(timestamp, x, color="x")) + 
             geom_line(aes(timestamp, y, color="y")) + 
             geom_line(aes(timestamp, z, color="z")) + 
             scale_x_datetime() + xlab("Time") + ylab("acceleration")
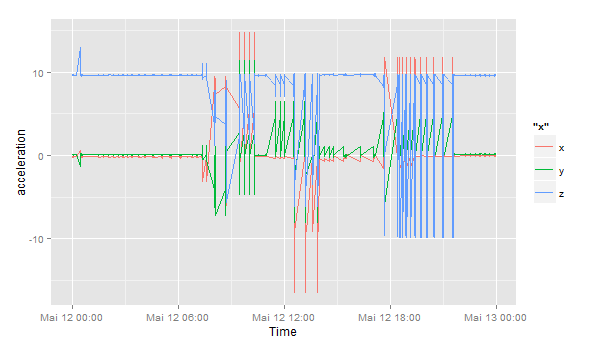
sensor_all

Let’s zoom in to the period between 12:32 and 13:00:

ggplot(df[df$timestamp >= '2014-05-12 12:32:00' & df$timestamp < '2014-05-12 13:00:00',]) +
  geom_line(aes(timestamp, x, color="x")) + 
  geom_line(aes(timestamp, y, color="y")) + 
  geom_line(aes(timestamp, z, color="z")) + 
  scale_x_datetime() + xlab("Time") + ylab("acceleration")
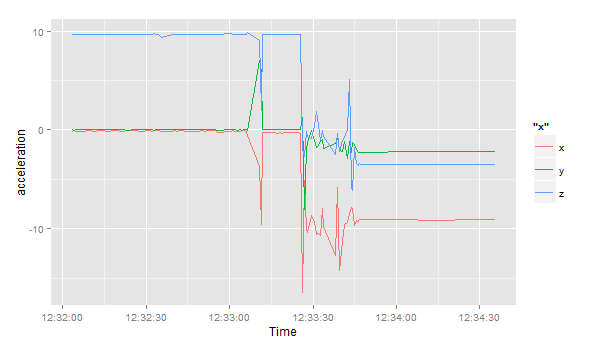
sensor_zoom

Then, I load the Breakoutdetection library:

install.packages("devtools")
devtools::install_github("twitter/BreakoutDetection")
library(BreakoutDetection)
bo <- breakout(df$x[df$timestamp >= '2014-05-12 12:32:00' & df$timestamp < '2014-05-12 12:35:00'], 
               min.size=10, method='multi', beta=.001, degree=1, plot=TRUE)
bo$plot

sensor_breakout

This quick analysis of the acceleration in the x direction gives us 4 change points, where the acceleration suddenly changes. In the beginning, the smartphone seems to lie flat on a horizontal surface – the sensor is reading a value of around 9.8 in positive direction – this means, the gravitational force only effects this axis and not the x and y axes. Ergo: the smartphone is lying flat. But then things change and after a few movements (our change points) the last observation has the smartphone on a position where the x axis has around -9.6 acceleration, i.e. the smartphone is being held in landscape orientation pointing to the right.

Data Storytelling: Stepwise Abstraction from Raw Data

Data storytelling has become a regular topic at data science conferences, and with good cause. First: The story is what gives meaning to the data, leads to people understanding our analysis, and supports the discussion of our findings, but second: Our interpretation of the data is at least to some extend arbitrary and subjective, and no harm is done to admit that. Compared however to stories without any data support, data-driven narratives have a far better chance to maintain their statement. No wonder, data-driven journalism is on the rise.

In social sciences, we are used to data that are already highly abstract. We ask people, “Can you remember this ad?” Without much questioning the concept behind using what we presume to be words of everyday language. Hence the interpretation is straight forward.

When we use measurements instead of verbal surveys, the situation is much more complicated (but also much more interesting). The data we collect, e.g. from tracking mobile phones, as such doesn’t tell much, at all.

A useful step-by-step way to get meaning into data by gradually abstracting was proposed by Pei et.al.: “Human Behavior Cognition Using Smartphone Sensors“, Sensors 2013, 13, 1402-1424; doi:10.3390/s130201402
My approach is just a simplification of theirs.

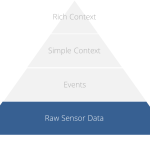
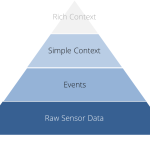
pyramid2In the first layer, we collect the raw data – which often is a demanding task in its own right.

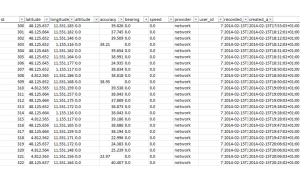
Raw data is just tables with numbers. Of course we know how to interpret latitude and longitude. But even the location data is much richer than just coordinates. To interpret the other readings we need to have meta data.

With the data just collected, we still do not see much. We have absolute numbers that are encoded to an arbitrary scale. If e.g. we have distances or speed measurements, the numbers won’t tell us, if metric or imperial scale is applicable. We don’t know of any tolerances either, don’t see the bias in missing values, and so on. So we usually have to enrich the raw readings with meta data. This step is called data munging.

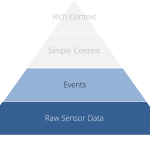
pyramid3Now we start abstracting from the raw data.

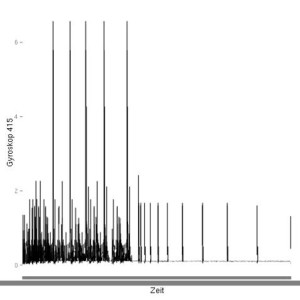
Telling gyroscope
In this example of gyroscope data, collected on a smartphone, we see sharp spikes shooting out regularly. This is a typical hardware artefact to be found everywhere in sensor data. These artefacts are quite unique to a specific device and can be used to re-identify it, like a fingerprint.
For the gyroscope data, collected e.g. with some fitness-tracker wristband, that would mean to calculate the number of steps walked. Thus, in the second layer, we derive events from the data. What an event is, might be highly arbitrary. Most tracking-gadgets count the number of steps significantly different, depending on the model chosen.

What somebody understands as the occurrence of certain event is also at least partly subjective. I might count some movement of mine as a step while someone else might already call it a leap. What we need to understand the events, is context.

pyramid4I the third layer, we derive simple context, e.g. by adding location data, or other environmental information like temperature.

Simple Context
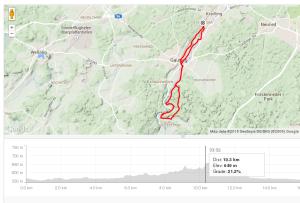
Fitness tracker usually put the measured data into some simple context on a dashboard. Strava e.g. shows grade and change in altitude.
Most fitness trackers do this in their dashboards by showing our training efforts in the context of the situation they could easily match with it. Did we run uphill or downhill?

pyramid5The fourth layer is finally the rich context. What did really happen? The rich context is hardly ever to be drawn just from our data. Historic, cultural, or medical conditions add to that. We won’t tell a plausible story, if we don’t embed it in the panorama that our audience would expect us to experience, if they would have lived through the story in person. For rich context, we regularly need people’s opinions and personal situation. This is when data science finally gets married to classic social research: The questionnaire based interview – just ask people what they experienced while we measured what happened.

Data science lays the grounding for our pyramid, with social science at its pinnacle.

Anomaly Detection with Wikipedia Page View Data

Today, the Twitter engineering team released another very interesting Open Source R package for working with time series data: “AnomalyDetection“. This package uses the Seasonal Hybrid ESD (S-H-ESD) algorithm to identify local anomalies (= variations inside seasonal patterns) and global anomalies (= variations that cannot be explained with seasonal patterns).

As a kind of warm up and practical exploration of the new package, here’s a short example on how to download Wikipedia PageView statistics and mine them for anomalies (inspired by this blog post, where this package wasn’t available yet):

First, we install and load the necessary packages:

library(RJSONIO)
library(RCurl)
library(ggplot2)
install.packages("devtools")
devtools::install_github("twitter/AnomalyDetection")
library(AnomalyDetection)

Then we choose an interesting Wikipedia page and download the last 90 days of PageView statistics:

page <- "USA"
raw_data <- getURL(paste("http://stats.grok.se/json/en/latest90/", page, sep=""))
data <- fromJSON(raw_data)
views <- data.frame(timestamp=paste(names(data$daily_views), " 12:00:00", sep=""), stringsAsFactors=F)
views$count <- data$daily_views
views$timestamp <- as.POSIXlt(views$timestamp) # Transform to POSIX datetime
views <- views[order(views$timestamp),]

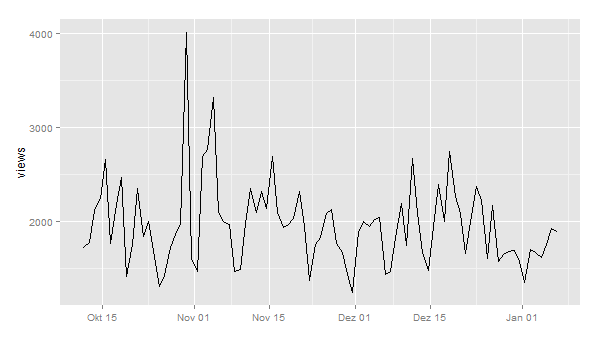
I also did some pre-processing and transformation of the dates in POSIX datetime format. A first plot shows this pattern:

ggplot(views, aes(timestamp, count)) + geom_line() + scale_x_datetime() + xlab("") + ylab("views")

wikipedia_views_USA

Now, let’s look for anomalies. The usual way would be to feed a dataframe with a date-time and a value column into the AnomalyDetection function AnomalyDetectionTs(). But in this case, this doesn’t work because our data is much too coarse. It doesn’t seem to work with data on days. So, we use the more generic function AnomalyDetectionVec() that just needs the values and some definition of a period. In this case, the period is 7 (= 7 days for one week):

res = AnomalyDetectionVec(views$count, max_anoms=0.05, direction='both', plot=TRUE, period=7)
res$plot

wikipedia_anomalies_usa

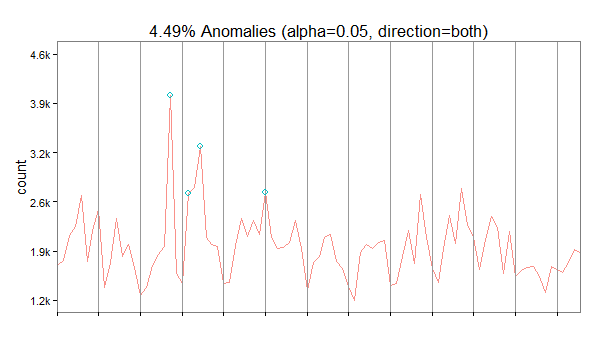
In our case, the algorithm has discovered 4 anomalies. The first on October 30 2014 being an exceptionally high value overall, the second is a very high Sunday, the third a high value overall and the forth a high Saturday (normally, this day is also quite weak).

Coolhunting like a Streetfighter

bk_pydata
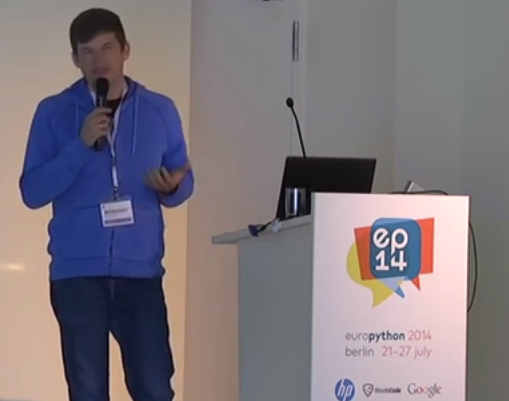
One of the most exciting applications of Social Media data is the automated identification, evaluation and prediction of trends. I already sketched some ideas in this blog post. Last year – and this was one of my personal highlights – I had the opportunity to speak at the PyData 2014 Berlin on the topic of Street Fighting Trend Research.

In my talk I presented some more general thoughts on trend research (or “coolhunting” as it is called nowadays) on the Internet. But at the core were three examples on how to identify research trends from the web (see this blogpost), how to mine conference proposals (see this analysis of Strata abstracts) and how to identify trending locations on Foursquare (see here). All three examples are also available as IPython Notebooks on my Github page. And here’s the recorded version of the talk.

The PyData conference was one of the best conferences I attended. Not only were the topics very diverse – ranging from GPU optimization to the representation of women in the PyData community – but also the people attending the conference were coming from different backgrounds: lawyers, engineers, physicists, computer scientists (of course) or statisticians. But still, with every talk and every conversation in the hallways, you could feel the wild euphoria connecting us all with the programming language and the incredible curiosity.

2014 highlight (2): On of the best courses on Big Data and Data Mining

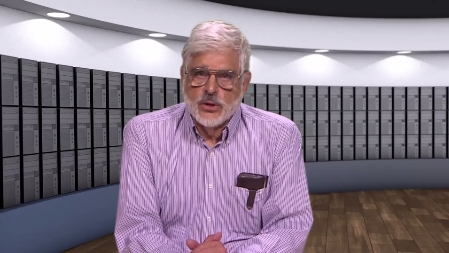
I already mentioned the Hastie & Tibshirani course on statistical learning as one of my personal highlights in data science last year. My second highlight is also an online course, also by leading experts on their field (this time: Big Data and data mining), also based on a (freely available) book and also by Stanford University professors: Jure Leskovec, Anand Rajamaran and Jeff Ullman’s course on “Mining Massive Datasets”.

ullman_mmds

If you’re interested in data science or data mining, chances are high that you have already been in touch with their book. It can safely be considered a standard work on the fascinating intersection of data mining algorithms, machine learning and Big Data. The 7 week course is the online version of the Stanford courses CS246 and the earlier version of CS345A.

mmds_cover_v21The course is very dense and covers a lot of territory from the book, for example:

  • How does Map Reduce work and why is it important?
  • How can I retrieve frequently appearing combinations from very large sets of items such as shopping baskets?
  • How to retain information about a datastream that does not fit in memory?
  • What are the most common tasks in supervised machine learning and how to implement them?
  • How do I program an intelligent system for recommending movies?
  • How to compute optimal placements of online advertisements?

Some of the lectures are on a beginners to intermediate level, but some lectures cover very advanced topics. What I especially liked about this course is that a lot of the material covered really is state-of-the-art in data mining. Some algorithms – e.g. the BIGCLAM community detection and CUR matrix decomposition – had only been developed about year ago.

So, take a look at the book, and if you haven’t already: enroll at the Coursera course website to make sure you won’t miss the next session of this course.

Work in Progress – 3 great (almost) unpublished data science books

One thing that’s particularly great about the Internet is the Sharing Economy. So much information, know-how, content is given out for free on a daily basis. Here’s three fascinating unpublished books that you can take a look at right now. And to make them even greater, you can always give the authors your feedback, bugs you’ve discovered or just a big thank you!

masteringbitcoin_coverThe first book from O’Reilly’s Early Release series is “Mastering Bitcoin” by Andreas Antonopoulos. If you want to learn more about how the new crypto-currency works or if you want to imagine how this concept will change the world or just understand how you can use the Bitcoin APIs to build your own tools, this is the place to start. I hope this book will give me lots of inspiration about analyzing and visualizing the Blockchain (see this blogpost).

“Deep Learning” is the somewhat humble title of the second book. This work by Yoshua Bengio, Ian J. Goodfellow and Aaron Courville (University of Montréal) on the theory and practice of neural networks a.k.a. deep learning could someday become a standard introduction. On their webpage, you can download and read the book chapter by chapter – but as this is work in progress, there could be quite a lot of updates in the future. So grab it while it is still fresh.

barabasi_coverThe third one is already a classic and very well received by the peer group: “Network Science” by Albert-László Barabási. This book explains the science of networks and social network analysis from the beginning (history- and concept-wise) right to the 21. century. From finding and identifying Terrorists to analyzing and optimizing organizational structure – this book abounds with colorful examples and real applications. Everyone who has been thinking “Yeah, network visualizations look pretty nice, but what’s the real use-case besides that?” should definitely take a look at this work. The best thing: it will stay free because it’s published under a Creative Commons license. Thanks, László!

New Podcast on Machine Learning

talkingmachinesThis new machine learning podcast “Talking Machines – Human Conversations on Machine Learning” really sounds like a lot of fun (and deep insight of course):

We start with Kevin Murphy of Google talking about his textbook that has become a standard in the field. Then we turn to Hanna Wallach of Microsoft Research NYC and UMass Amherst and hear about the founding of WiML (Women in Machine Learning). Next we discuss academia’s relationship with business with Max Welling from the University of Amsterdam, program co-chair of the 2013 NIPS conference (Neural Information Processing Systems). Finally, we sit down with three pillars of the field Yann LeCun, Yoshua Bengio, and Geoff Hinton to hear about where the field has been and where it might be headed.

Downloading the first episode from January 1st right now.

The Top 7 Beautiful Data Blog Posts in 2014

Domo_After2014 was a great year in data science – and also an exciting year for me personally from a very inspirational Strata Conference in Santa Clara to a wonderful experience of speaking at PyData Berlin to founding the data visualization company DataLion. But it also was a great year blogging about data science. Here’s the Beautiful Data blog posts our readers seemed to like the most:
  1. Datalicious Notebookmania – My personal list of the 7 IPython notebooks I like the most. Some of them are great for novices, some can even be challenging for advanced statisticians and datascientists
  2. Trending Topics at Strata Conferences 2011-2014 – An analysis of the topics most frequently mentioned in Strata Conference abstracts that clearly shows the rising importance of Python, IPython and Pandas.
  3. Big Data Investment Map 2014 – I’ve been tracking and analysing the developments in Big Data investments and IPOs for quite a long time. This was the 2014 update of the network mapping the investments of VCs in Big Data companies.
  4. Analyzing VC investment strategies with Crunchbase data – This blog post explains the code used to create the network.
  5. How to create a location graph from the Foursquare API – In this post, I explain a way to make sense out of the Foursquare API and to create geospatial network visualizations from the data showing how locations in a city are connected via Foursquare checkins.
  6. Text-Mining the DLD Conference 2014 – A very similar approach as I used for the Strata conference has been applied to the Twitter corpus refering to Hubert Burda Media DLD conference showing the trending topics in tech and media.
  7. Identifying trends in the German Google n-grams corpus – This tutorial shows how to analyze Big data-sets such as the Google Book ngram corpus with Hive on the Amazon Cloud.

Querying the Bitcoin blockchain with R

The crypto-currency Bitcoin and the way it generates “trustless trust” is one of the hottest topics when it comes to technological innovations right now. The way Bitcoin transactions always backtrace the whole transaction list since the first discovered block (the Genesis block) does not only work for finance. The first startups such as Blockstream already work on ways how to use this mechanism of “trustless trust” (i.e. you can trust the system without having to trust the participants) on related fields such as corporate equity.

So you could guess that Bitcoin and especially its components the Blockchain and various Sidechains should also be among the most exciting fields for data science and visualization. For the first time, the network of financial transactions many sociologists such as Georg Simmel theorized about becomes visible. Although there are already a lot of technical papers and even some books on the topic, there isn’t much material that allows for a more hands-on approach, especially on how to generate and visualize the transaction networks.

The paper on “Bitcoin Transaction Graph Analysis” by Fleder, Kester and Pillai is especially recommended. It traces the FBI seizure of $28.5M in Bitcoin through a network analysis.

So to get you started with R and the Blockchain, here’s a few lines of code. I used the package “Rbitcoin” by Jan Gorecki.

Here’s our first example, querying the Kraken exchange for the exchange value of Bitcoin vs. EUR:

library(Rbitcoin)
## Loading required package: data.table
## You are currently using Rbitcoin 0.9.2, be aware of the changes coming in the next releases (0.9.3 - github, 0.9.4 - cran). Do not auto update Rbitcoin to 0.9.3 (or later) without testing. For details see github.com/jangorecki/Rbitcoin. This message will be removed in 0.9.5 (or later).
wait <- antiddos(market = 'kraken', antispam_interval = 5, verbose = 1)
market.api.process('kraken',c('BTC','EUR'),'ticker')
##    market base quote           timestamp market_timestamp  last     vwap
## 1: kraken  BTC   EUR 2015-01-02 13:12:03             <NA&gt; 263.2 262.9169
##      volume    ask    bid
## 1: 458.3401 263.38 263.22

The function antiddos makes sure that you’re not overusing the Bitcoin API. A reasonable query interval should be one query every 10s.

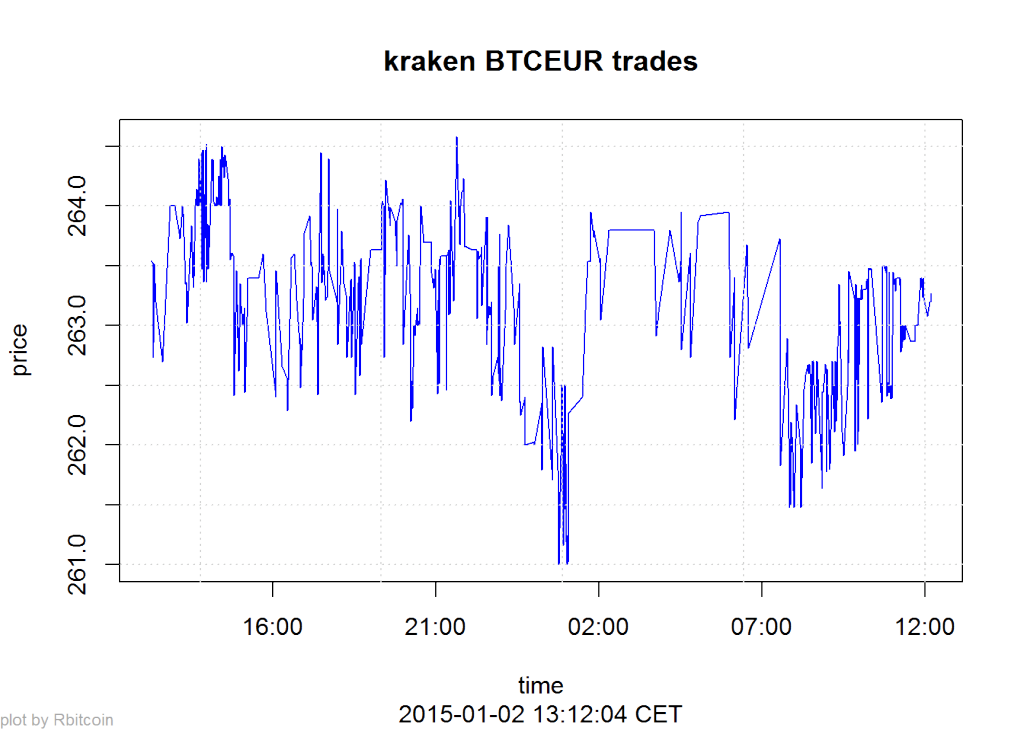
Here’s a second example that gives you a time-series of the lastest exchange values:

trades <- market.api.process('kraken',c('BTC','EUR'),'trades')
Rbitcoin.plot(trades, col='blue')

btc_kraken

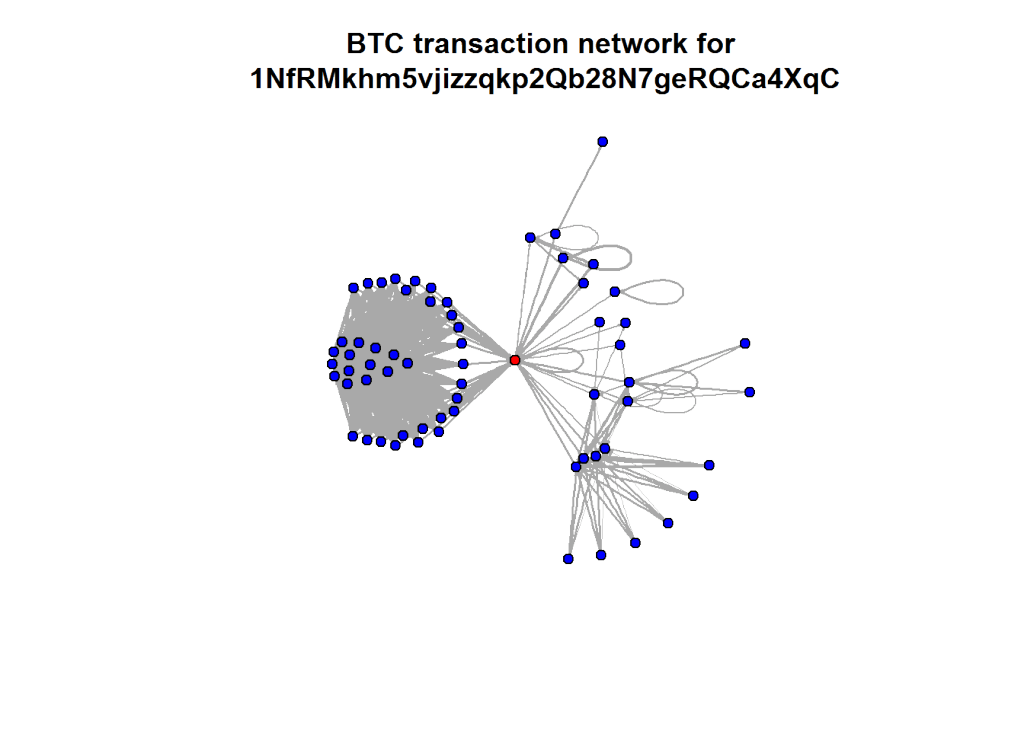
The last two examples all were based on aggregated values. But the Blockchain API allows to read every single transaction in the history of Bitcoin. Here’s a slightly longer code example on how to query historical transactions for one address and then mapping the connections between all addresses in this strand of the Blockchain. The red dot is the address we were looking at (so you can change the value to one of your own Bitcoin addresses):

wallet <- blockchain.api.process('15Mb2QcgF3XDMeVn6M7oCG6CQLw4mkedDi')
seed <- '1NfRMkhm5vjizzqkp2Qb28N7geRQCa4XqC'
genesis <- '1A1zP1eP5QGefi2DMPTfTL5SLmv7DivfNa'
singleaddress <- blockchain.api.query(method = 'Single Address', bitcoin_address = seed, limit=100)
txs <- singleaddress$txs

bc <- data.frame()
for (t in txs) {
  hash <- t$hash
  for (inputs in t$inputs) {
    from <- inputs$prev_out$addr
    for (out in t$out) {
      to <- out$addr
      va <- out$value
      bc <- rbind(bc, data.frame(from=from,to=to,value=va, stringsAsFactors=F))
    }
  }
}

After downloading and transforming the blockchain data, we’re now aggregating the resulting transaction table on address level:

library(plyr)
btc <- ddply(bc, c("from", "to"), summarize, value=sum(value))

Finally, we’re using igraph to calculate and draw the resulting network of transactions between addresses:

library(igraph)
btc.net <- graph.data.frame(btc, directed=T)
V(btc.net)$color <- "blue"
V(btc.net)$color[unlist(V(btc.net)$name) == seed] <- "red"
nodes <- unlist(V(btc.net)$name)
E(btc.net)$width <- log(E(btc.net)$value)/10
plot.igraph(btc.net, vertex.size=5, edge.arrow.size=0.1, vertex.label=NA, main=paste("BTC transaction network for\n", seed))

btc_network

2014 highlight (1): Statistical Learning course by Hastie & Tibshirani

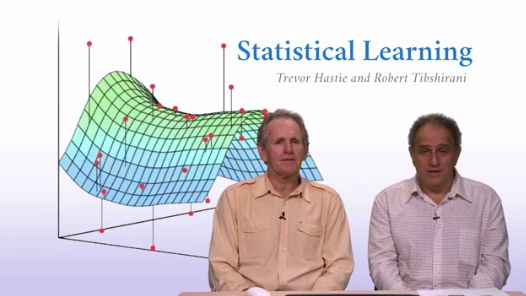
What I like most about the R and Python developer and user communities, is their incredible openness and generosity. One of the finest examples in the past year was the online course “Statistical Learning” taught by Stanford professors Trevor Hastie and Rob Tibshirani.

statlearning_screenshot

In this MOOC they explain very understandably (even for beginners) the basics of statistical modeling (or machine learning) techniques such as linear, polynomial and logistic regression, smoothing splines, Ridge regression, Lasso, Generalized Additive Models, various methods for classification (Classification Trees to random forests) and also unsupervised learning methods.

But the highlights of this course are the R labs between all units. In these sessions, the statistical theory is supplemented with many practical examples. It’s really fantastic to hear the authors explain and teach the (very essential) R packages they wrote themselves. For me, the course was also an impetus to learn even more about knitr. Especially if you’re used to IPython notebook, this combination of code and output can be very intuitive and useful. Even months after going through the course, I refer to my lab R code (see also here) when I need some quick templates for common statistical modelling tasks. I really liked the strong focus on cross validation methods – many basic courses on statistics focus only on the methods and not on how to estimate how well you’re predicting.

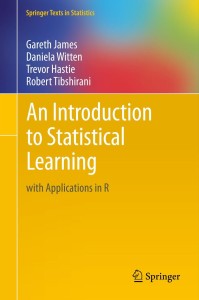
ISL Cover 2The course is based on the textbook “Introduction to Statistical Learning” (or short: ISL, download here) Hastie and Tibshirani wrote together with Gareth James and Daniela Witten. If you want to dive even deeper into the subject, you can also work through the more advanced work “Elements of Statistical Learning” (ESL, download).

So, if one of your New Year resolutions for 2015 is, learning how to do more with R, you should definitively take a look at this course. The next free class is starting on January 19.

Continue with part 2 of the 2014 highlights.