A risk is defined as the probability of an undesirable event to take place. Since most risks are not totally random but rather dependent of a range of influences, we try to quantify a risk function, that gives the probability for each set of influences. We then calculate the expected loss by multiplying the costs that are caused by the occurrence of this event with the risk, i.e. its probability.
Often, the influences can be changed by our actions. We might have a choice. So it makes sense to look for a course of actions that would minimize the loss function, i.e. lead to as little expected damages as possible.
Algorithms that run in many procedures and on many devices often make decisions. Prominent examples are credit scoring or shop recommendation systems. In both cases it is clear that the algorithm should be designed to optimize the economic outcome of its decision. In both cases, two risks emerge: The risk of a false negative (i.e. wrongly give credit to someone who cannot pay it back, resp. make a recommendation that does not fit the customer’s preferences), and the risk of a false positive (not granting credit to a person that would have been creditworthy, resp. not offering something that would have been exactly what the customer was looking for).
There is however an asymmetry in the losses of these two risks. For the vast majority of cases, it is far more easy to calculate the loss for a false negative than for the false positive. The cost of credit default is straightforward. The cost of someone not getting the money is however most certainly bigger than just the missed interests; the potential borrower might very well go away and never come back, without us ever realizing.
Even worse, while calculating risk is (more or less) just maths and statistics, different people might not even agree on the losses. In our credit scoring example: One might say, let’s just take what we know for sure, i.e. the opportunity costs of missed interests, the other might insist to evaluate a broader range of damages. The line where to stop is obviously arbitrary. So while the risk function can be made somehow objective, the loss function will be much more tricky and most of the time prone to doubt and discussion.
Collision decision
In the IoT – the world of connected devices, of programmable object, the problem of risks and losses becomes vital. Self-driving cars will cause accidents, too, even if they are much safer than human drivers. If a collision is inevitable, how should the car react? This was the key question ask by Majken Sander in our talk on algorithm ethics at Strata+Hadoop World. If it is just me in the car, a possible manoeuvre would turn the car sideways. If however my children sit next to me, I might very well prefer a frontal crash and rather have me injured than my passengers. Whatever I would see as the right way to act, it is clear that I want to make the decision myself. I would not want to have it decided remotely without my even knowing on what grounds.
Sometimes people mention that even for human casualties, a monetary calculation could be done -no matter how cruel that might sound. We could e.g. take the valuation of humans according to their life expectancy, insurance costs, or any other financial indicator. However, this is clearly not, how we would usually deal with lethal risks. “No man left behind” -how could we explain Saving-Private-Ryan-ish campaigns on economic grounds? Since the human casualty in the values of our society is regarded as total, not commensurable (even if a compensation can be defined), we get a singularity in our loss function. Our metric just doesn’t work here. Hence there will be no just algorithm to deal with a decision of that dimension.
Calculate risks, let losses be open
We will nevertheless have to find a solution. One suggestion for the car example is, that in risky situations, the car would re-delegate the driving back to a human to let them decide.
This can be generalized: Since the losses might be valuated differently by different people, it should always be well documented and fully transparent to the users, how the losses are calculated. In many cases, the loss function could be kept open. The algorithm could offer different sets of parameters to let the users decide on the behavior of product.
As a society we have to demand to be in charge defining the ethics behind the algorithms. It is a strong cause for regulation, I am convinced about that. It is not an economic, but a political task.
Abstract: Data is the new media. Thus the postulates of our Slow Media Manifesto should be applicable on Big Data, too. Slow Data in this sense is meaningful data, relevant for society, driving creativity and scientific thinking. Slow Data is beautiful data.
From Slow Media to Slow Data
Five years ago we wrote the Slow Media Manifesto. We were concerned about the strange dichotomy by which people separated old media from new media to make their point about quality, ethics, and aesthetics. With Big Data, I now encounter a similar mindset. Just like people were scoffing social media to be just doodles, scribbling, or worse, I now see people scornfully raising their eyebrows about the lack of structure, missing consistency, and other alleged flaws they imagine Big Data to carry. As if “good old data” with a small sample size, representativeness, and other formalistic criteria would be a better thing as such. Again what these people see is just an evil new vice swamped over their mature businesses by unseasoned startups however, insanely well funded. I have gone through this argument twice already. It was wrong in the 90s when the web started, it was wrong again in the 2000s regarding social media, and it will not become right this time. Because it is not the technology paradigm that makes quality.
A mathematician, like a painter or a poet, is a maker of patterns. If his patterns are more permanent than theirs, it is because they are made with ideas. Beauty is the first test: there is no permanent place in the world for ugly mathematics.
Godfrey Harold Hardy
Data is the new media. I have written about this, too. The traditional concept of media becomes more and more directly intertwined with data, with data storytelling, data journalism, and their likes, indirectly because search, targeted advertising, content filtering, and other predictive technologies increasingly influence what we will find presented as media content.
Therefore I think it makes sense to take Slow Media and ask about Slow Data, too.
Highly curated small data
For what is useful above all is technique.
Godfrey Harold Hardy
Direct marketing data sets tend to be not very high quality (sorry CRM folks, but I know what I am talking about). Many records are only partly qualified, if at all. Moreover, the information on which the targeting is based is often outdated.
Small samples can enhance large heaps of data
In 2006 I oversaw a major market survey, the Typologie der Wünsche. This very expensive market research was conducted diligently according to the rules of the trade of social science. The questionnaire went through the toughest lectorship before it would be considered ready to be send out to the interviewers. The survey was done face to face, based on a cautiously drawn sample of 10.000 people per year. The results underwent permanent quality assurance. To be sure about the quality of the survey it was conducted by three independent research agencies. By doing this we could cross check plausibility.
Since my employer was also involved in direct marketing with a huge database of addresses, call centers, and logistics, we developed a method to use the highly curated market survey with its rather small sample to calibrate and enhance the “dirty” records of the CRM business. This was working so well that we started a cooperation with Deutsche Post to do the same, but on a much larger scale. Our small but precious data was matched with all 40 million addresses in Germany.
When working for MediaCom I was involved with a similar project. Television ratings are measured by expensive panels in most markets, usually run and funded by joint industry committees like BARB in the UK or AGF in Germany. Of course such a panel is restricted to just a few thousand households. Since in traditional broadcasting there are only some ten relevant TV channels in any market, this panel size is sufficient to support media planning. But internet usage is so much more fragmented that a panel of that sort would hardly make sense. So we took the data that we had collected via web tracking – again some 40 million records. We again found a way to infuse the TV panel data into the online data and could by that calculate the probabilities that the owner of a certain cookie would have had contact with a certain advertising campaign on TV or not. And again a small but highly curated and very specialized data set was used to greatly increase the value of the larger Big Data set.
Bringing scientific knowledge into Big Data
Archimedes will be remembered when Aeschylus is forgotten, because languages die and mathematical ideas do not.
Godfrey Harold Hardy
Another example where small but highly curated data is crucial for data science are data sets that contain scientific information which otherwise is not inherent in the data. Text mining works best when you can use quantitative methods without thinking about those difficult cultural concepts like ‘meaning’ or ‘semantics’. Detection of relevant content with ngram ranking, or text comparison based on cosine vector distance are the most powerful tools to analyze texts even in unfamiliar languages or alphabets. However, all the quantitative text mining procedures require the text to be preprocessed: All vocabulary with only grammatical function that would not add to the meaning has to be stripped off first. It is also useful to bring the words to their root form (picture verbs into infinitive, nouns into nominative singular). This indispensable work is done with special corpora, dictionaries, or better call it libraries, that contain all the required information. These corpora are handmade by linguists. Packages like Python’s NLTK have them incorporated in a handy way.
I am interested in mathematics only as a creative art.
Godfrey Harold Hardy
“Beautiful evidence” is what Edward Tufte calls good visualization. Information can truly be brought to us in a beautiful way. Data visualization as an art form had also entered the Sanctum of high arts when the group Asymptote was presented at Documenta 11 in 2002. Visual storytelling today has transformed. What used to be cartoons or engravings like this one here to illustrate the text, is now infographics that are the story.
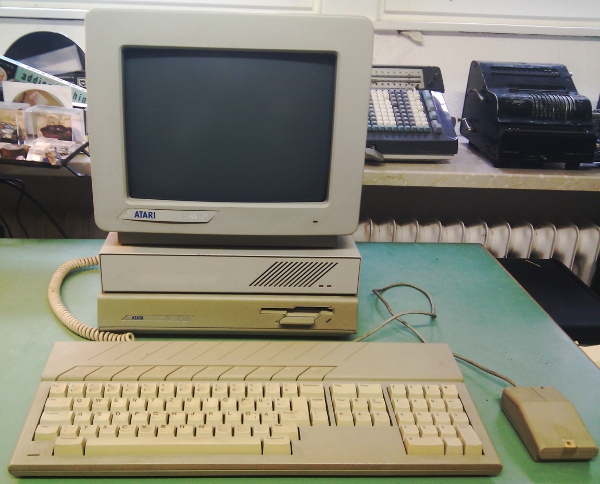
Generative art is another data-driven art format. When I was an undergraduate The Fractal Geometry of Nature had finally tickled down to the math classes. With my Atari Mega ST I devoured all fractal code snippets I could get into my hands. What fascinated me most were not the (usually rather kitschy) colorful fractal images. I wanted to have fractal music, generative music that would evolve algorithmically from my code.
Although fractals as an art-thing where certainly more a fad, not well suited to turn into real art, generative art as such has since then become a strong branch in the Arts. Much of today’s music relies heavily on algorithmic patterns in many of its dimensions, from rhythm to tune, to overtone spectra. Also in video art, algorithmically rendered images are ubiquitous.
Art from data will further evolve. I trust we will see data fiction become a genre of its own.
Data as critique
… there is no scorn more profound, or on the whole more justifiable, than that of the men who make for the men who explain. Exposition, criticism, appreciation, is work for second-rate minds.
Godfrey Harold Hardy
Critique is the way to think in the alternative. Critique means not to trust what is sold to you as truth. Data is always ambiguous. Meaning is imposed upon data by interpretation. Critique is to deconstruct interpretation, to give room for other ways to interpret. The other stories we may draw from our data do not have to be more plausible, at all. Often the absurd is what unveils hidden aspects of our models. As long as our alternative interpretations are at least possible, we should follow these routes to see where they end. Data fiction is the means to turn data into a tool of critique.
Data science has changed our perception of how lasting we take our results to be. In data science we usually do not see a conclusion as true or permanent. Rather we hope that a correlation or pattern that we observe will remain stable, at least for a while. There is no hypothesis that we would accept and then tick off just because our test statistics turned significant. We would always continue to a/b-test alternative models, that would substitute an earlier winner of the test-game. In data science, we maximize critical thinking by not even seeing what we do as falsification because we would not have thought of the previous state as true in the first place. Truth in data science means just the most plausible interpretation at a time; ephemeral.
Slow Data accordingly means to use data to deconstruct the obvious, as well as to built alternatives.
Ethical data
A science is said to be useful if its development tends to accentuate the existing inequalities in the distribution of wealth, or more directly promotes the destruction of human life.
Godfrey Harold Hardy
The two use cases that dominate the discussion about Big Data are the right opposite of ethical: Targeted advertising, and mass surveillance. As Bruce Sterling points out, both are in essence just two aspects of the same thing that he calls ‘surveillance marketing’. I feel sad that this is what seams to be the prominent use of our work: To sell things to people who do not want them, and to keep people down.
However, I am confident that the benign uses of Big Data will soon offer such high incentive that we will awake from our military marketing nightmares. With open data we build a public space. All the most useful Big Data tools are all in the pubic domain anyway: Hadoop, Mesos, R, Python, Gephy, etc. etc.
Ethical data is data that makes a difference for society. Ethical data is relevant for people’s lives: To control traffic, to make agriculture more sustainable, to supply energy, to help plan cities and administer the states. This data will be crucial to facilitate our living together with ten billion people.
Slow Data is data that makes a difference for people’s lives.
Political data
It is never worth a first class man’s time to express a majority opinion. By definition, there are plenty of others to do that.
Godfrey Harold Hardy
“Code is Law” is the catch phrase of Lawrence Lessig famous bestseller on the future of democracy. From the beginning of the Internet revolution, there has been the discussion, whether our new forms of media and communication would lead to another revolution as well: a political one. Many of the media and platforms that rose over last decade show aspects of communal or even social systems – and hence might be called Social Media with good cause. It does not come as a surprise that we start to see the development of the communication platforms that are genuinely meant to support and at the same time to experiment with new forms of political participation, like Proxy-Voting or Liquid Democracy, which had been hardly conceivable without the infrastructure of the Web. Since these new forms of presenting, debating, and voting for policies have been started occurring just recently we can expect that many other varieties will appear, new concepts to translate the internet paradigm into social decision making. Nevertheless, how do these new forms of voting work? Are they really mapping the volonté generale into decisions? If so, will it work in a sustainable, stable, continuous way? And how to evaluate the systems, one compared to another? I currently work in a scientific research project on how to deal with these questions. Today I am not yet ready to present conclusions. Nonetheless, I already see that using data for quantitative simulation is a good approach to approximate the complex dynamics of future data-driven political decision-making.
Politics as defined by Aristotle means to have the freedom to make decisions based on ethics and beliefs and not driven by necessities, the latter is what he calls economics. To deal with law in this sense is similar to my text mining example above. If law is codified, it can be executed syntactically, indeed quite similar to a computer program. But to define what is just, what should be put into the laws, is not syntactical, at all. Ideally this would be exclusively political. I don’t think, algorithmic legislation would be desirable, I doubt that it would be even feasible.
Slow Data means to use data to explore new forms of political participation without rush.
Machine thinking
Chess problems are the hymn-tunes of mathematics.
Godfrey Harold Hardy
‘Could a machine think?’ is the core question of AI. The way we think about answering this question immediately lead us beyond computer science: What does it mean to think? What is consciousness? Since the 1980s there has been a fascinating exchange of arguments about the possibility of artificial intelligence, culminating in the Chinese Room debate between John Searle and the Churchlands. Searle and in an even more abstract way, David Chalmers made good points why a simulation of consciousness that would even pass the Turing test, would never become really conscious. Their counterparts, most prominent Douglas Hofstadter, would reject Chalmers neo-Kantianism as metaphysics.
Google has recently published an interesting paper on artificial visual intelligence. They trained mathematical models with random pictures from social media sites. And – surprise! – their algorithm came up with a concept of “What is a cat?”. The point is, nobody had told the algorithm to look for cat-like patterns. Are we witnessing the birth of artificial intelligence here? On the one hand, Google’s algorithm seams to do exactly what Hofstadter predicted. It is adaptive to environmental influences and translates the sensory inputs into something that we interpret as meaning. On the other side was the training sample far from random. The pictures were what people had pictured. It was a collaboratively curated set of rather small variety. The pattern the algorithm found was in fact imposed by “classic” consciousnesses, by the minds of “real” people.
Slow Data is the essence that makes our algorithm intelligent.
The beauty of scientific data
Beauty is the first test: there is no permanent place in this world for ugly mathematics.
Godfrey Harold Hardy
Now returning to Hardy’s quote from the beginning, when I was studying mathematics I was puzzled by the strange aestheticism that many mathematicians would force upon their train of thoughts. Times have changed since then. Today we have many theorems solved that were considered hard problems. Computational proofing has taken its role in mathematical epistemology. Proofs filling thousands of pages are not uncommon.
Science, physics in particular, is driven by accurate data. Kepler could dismiss the simple heliocentric model because Tycho Brahe had measured the movements of the planets to such accuracy that the model of circular orbits could no longer be maintained. Edwin Hubble discovered the structure of our expanding universe because Milton Humason and other astronomers at Mt. Wilson had provided for spectroscopic images of thousands of galaxies, exact enough to derive Hubble’s constant from the redshift of the prominent Fraunhofer lines. Einstein’s Special Theory of Relativity relies on the data of Michelson and Morley who had shown that light would travel at constant speed, no matter the angle to the direction of our earth’s travel around the sun it was measured against. Such uncompromisingly accurate data, collected in a painstaking struggle without any guarantee to pay off – this is what really brought the great breakthroughs in science.
Finally, while mathematics is turning partially into syntax, the core of physics at the same time unfolds in the strange blossoms of the most beautiful mathematics imaginable. In the intersect of cosmology, dealing with the very largest objective imaginable – the entirety of the cosmos, and quantum physics on the smallest scale lies the alien world of black holes, string theory, and quantum gravity. The scale of these phenomena, the fabric of space-time is likely defined by relating Planck’s constant to Newton’s constant and the speed of light is so unimaginably small – some 40 powers of magnitude smaller than the size of an electron – that we can’t expect to measure any data even near to it any time soon. We can only rely on our logic, our sense for mathematical harmony, and the creative mind.
Slow Data
Slow Data – for me the space of beautiful data is spanned by these aspects. I am confident that we do not need an update to our manifesto. However, I hope that we will see many examples of valuable data, of data that helps people, that creates experiences unseen, and that opens the doors to new worlds of our knowledge and imagination.
Appendix: Slow Media
The Slow Media movement was kicked off with the Slow Media Manifesto that Sabria David, Benedikt Koehler and I had written on new year’s day 2010. Immediately after we had published the manifesto, it was translated into Russian, French, and some other 20 languages.
Data storytelling has become a regular topic at data science conferences, and with good cause. First: The story is what gives meaning to the data, leads to people understanding our analysis, and supports the discussion of our findings, but second: Our interpretation of the data is at least to some extend arbitrary and subjective, and no harm is done to admit that. Compared however to stories without any data support, data-driven narratives have a far better chance to maintain their statement. No wonder, data-driven journalism is on the rise.
In social sciences, we are used to data that are already highly abstract. We ask people, “Can you remember this ad?” Without much questioning the concept behind using what we presume to be words of everyday language. Hence the interpretation is straight forward.
When we use measurements instead of verbal surveys, the situation is much more complicated (but also much more interesting). The data we collect, e.g. from tracking mobile phones, as such doesn’t tell much, at all.
A useful step-by-step way to get meaning into data by gradually abstracting was proposed by Pei et.al.: “Human Behavior Cognition Using Smartphone Sensors“, Sensors 2013, 13, 1402-1424; doi:10.3390/s130201402
My approach is just a simplification of theirs.
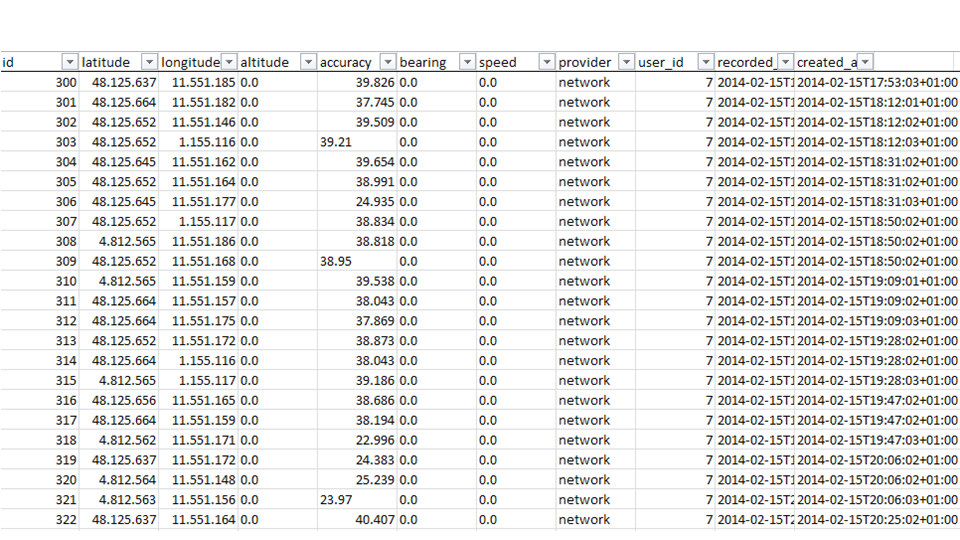
In the first layer, we collect the raw data – which often is a demanding task in its own right.Raw data is just tables with numbers. Of course we know how to interpret latitude and longitude. But even the location data is much richer than just coordinates. To interpret the other readings we need to have meta data.
With the data just collected, we still do not see much. We have absolute numbers that are encoded to an arbitrary scale. If e.g. we have distances or speed measurements, the numbers won’t tell us, if metric or imperial scale is applicable. We don’t know of any tolerances either, don’t see the bias in missing values, and so on. So we usually have to enrich the raw readings with meta data. This step is called data munging.
Now we start abstracting from the raw data. In this example of gyroscope data, collected on a smartphone, we see sharp spikes shooting out regularly. This is a typical hardware artefact to be found everywhere in sensor data. These artefacts are quite unique to a specific device and can be used to re-identify it, like a fingerprint.For the gyroscope data, collected e.g. with some fitness-tracker wristband, that would mean to calculate the number of steps walked. Thus, in the second layer, we derive events from the data. What an event is, might be highly arbitrary. Most tracking-gadgets count the number of steps significantly different, depending on the model chosen.
What somebody understands as the occurrence of certain event is also at least partly subjective. I might count some movement of mine as a step while someone else might already call it a leap. What we need to understand the events, is context.
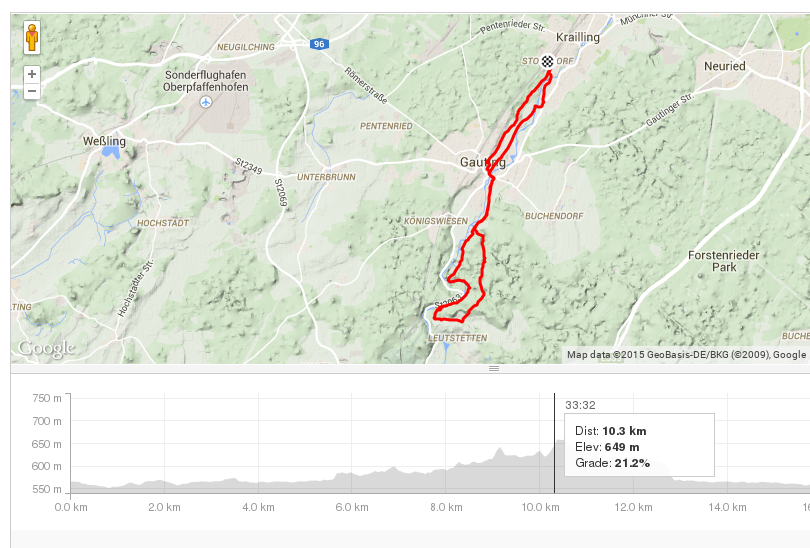
I the third layer, we derive simple context, e.g. by adding location data, or other environmental information like temperature. Fitness tracker usually put the measured data into some simple context on a dashboard. Strava e.g. shows grade and change in altitude.Most fitness trackers do this in their dashboards by showing our training efforts in the context of the situation they could easily match with it. Did we run uphill or downhill?
The fourth layer is finally the rich context. What did really happen? The rich context is hardly ever to be drawn just from our data. Historic, cultural, or medical conditions add to that. We won’t tell a plausible story, if we don’t embed it in the panorama that our audience would expect us to experience, if they would have lived through the story in person. For rich context, we regularly need people’s opinions and personal situation. This is when data science finally gets married to classic social research: The questionnaire based interview – just ask people what they experienced while we measured what happened.
Data science lays the grounding for our pyramid, with social science at its pinnacle.
“One hundred and sixty eight (68 men and 100 women) undergraduates from a small, private college in Pennsylvania participate d in this study.”
(L. McDermott, T. Pettijohn II: “The Influence of Clothing Fashion and Race on the Perceived Socioeconomic Status and Person Perception of College Students.” Psychology & Society, 2011, Vol. 4 (2) , 64 ‐ 75
Draper: “What do women want?”
Stirling: “Who cares!”
One of my colleagues at Max-Planck-Institut once came to me with a draft paper. It dealt with dimorphism in sexes and would present evidence, that most differences could be explained from genetic heritage. The method that was mandatory practice at this institute was social biology -every behavior should only occur with humans (and animals likewise), if a clear evolutionary advantage could be derived from it. Since it was the early 90s, the fight of science against postmodernism was still at its peak. Postmodernist thinking, like “it could just be our imposing social conventions into our methods to learn what we already knew”, was brusquely brushed away, because “we use the scientific method, don’t we?”.
In the paper, my colleague presented results of some surveys he had conducted that showed correlation of the perceived “beauty” of people on images with the (I forgot how he had quantified it) beauty of the subject’s spouse (I also forgot the thesis he would derive thereof). The correlation was very weak, like R²~0.6 or so. But because he had surveyed several hundred people, it became significant; it proved his absurd postulate.
The scientific method in general, but in quantitative social sciences in particular, has four steps to take:
1. Formulate the hypothesis
2. Draw a representative sample of observations
3. Test the hypothesis and prove it significant
4. Publish the results for review.
For now I do not want to focus on the strange reviewing practices that do not really publish results but rather keep them within closely confined boundaries of scientific journals, inaccessible for the public, only available for a small academic elite, so that a sound review hardly takes place.
I want to discuss the first three steps, because during the last 20 years, my professional field has undergone a dramatic paradigm shift, regarding these, while the forth is still holding for the time being.
The quantitative methods in social science originate from the age of the mass society within a nation state. These methods were developed as tools to help management and politics with their decisions. Alternatives to be tested were usually simple. The industrial production process would not allow for subtile variations in the product, thus it would be sufficient to present very few – usually two – varieties to the survey’s subjects. People’s lives would be likewise simple: a teacher’s wife would show a distinctive consumption pattern, as would a coal miner. It would be good enough to know people’s age, gender, and profession to generalize from one specimen to the whole group. Representativeness means, that one element of a set is used to represent the whole set – and not just with the properties, that would characterize the set itself (like male/female, Caucasian/Asian, etc.); the whole set would inherit all properties of its representative. It is counting the set as one, as Alain Badiou puts it.
We are so used to this aggregation of people into homogeneous sets, that we hardly realize its existence anymore. The concept of “target groups” in advertising is justified with this, too. Brands buy advertising by briefing the agency with gender, age, education of the people the campaign should reach. Prominent is the ABC-Audience in the UK, a rough segmentation of the populace just by their buying power and cultural capital.
In the mass society, up to the 1970s, this more or less seemed to make sense. People in their class or milieu would behave sufficiently predictable. Especially television consumption still mirrors this aspect of mass society: ratings and advertising effect could be calculated and even predicted from the TV measurement panels with scientific precision. 2006 I came in charge of managing one of the largest and longest running social surveys, the “Typologie der Wünsche“. Topics covered where consumption, brand preferences, and many aspects of people’s opinions and daily routine, surveyed by personal interview of 10,000 participants per year. Preparing a joint study with Roland Berger Strategy Consultants, I examined the buyers of car brands regarding all aspects of them being defined as a “target group”. The fascinating result was: while in the 1980s to the mid 1990s, buyers of car brands had been indeed quite homogeneous regarding their political opinions, ecological preferences, consumption of other brands, etc., this seemed to wane away over the last decade. The variance increased dramatically, so that to speak of “the buyer of a car brand” could be questioned. This was even more true for fast-moving consumer goods. Superficially, this could be explained by daily consumption becoming cheaper in proportion to average income, so poorer consumers where no longer as much restricted to certain goods as in earlier times. But the observation would prevail, even if just people with comparable wealth were taken into account.
Our conclusion: the end of mass media (that my employer was suffering from, like most traditional publishers), might come along with the end of mass society, too. The concept of aggretating people by objective criteria, by properties observable from the outside, like gender, income, or education, was getting under pressure.
For Israeli military strategist Martin van Creveld, this is also the underlying condition for what he calls the “Transfromation of War”. In military philosophy, the corresponding paradigm is the idea of soldiers and civilians, unfolded by von Clausewitz. Van Crefeld argues, that the constructs of Clausewitz’ theory, like ‘peoples’ (‘Völker’) had never existed in the first place. They were just stories told to organize war at industrial scale. And van Crefeld explicitly deconstructs the gender gap in battle. His book is full of quantitative proof that men, just regarded from the physical perspective, would make no better soldiers, than women. The the distributions of women and men in size, weight, physical strength etc. are mainly overlapping. Of course, the mean size of men is taller for a few centimeters than the size of women. This mean difference is significant, if you make a t-test. But as always, a significant mean difference says nothing about the individual. Most women are as tall as most men. Just some men are taller, and some women are smaller.
The fallacy of significance-testing should be obvious. It presumes the subjects would be originating from different universes, disjoint subsets of the population. Testing takes it for granted, that hypothesis and alternative are truly distinct, that only one can hold. This is hardly ever the case when humans are concerned. For most properties that we are studying in social research, the intra-set variance is much bigger than the variance between two sets, be it gender, be it age, education, hair color, or what ever criteria we choose to form the subsets. Women in most aspects are in average less similar one to each other, than the value of the mean difference of women and men.
This given, the logical next question would be, if the method had been correct, at all. The conditions of the industrial age made it only possible to serve their products to aggregates of people. Representative democracy also only gives the choice between a handful party programmes. And mass media could in principle not match individual preferences. So it seemed logic to place people in categories, too, without bothering that dichotomous variables like sex might not be appropriate to map people’s gender. Quantitative social research just reproduced the ideological restrictions of mass society.
With the Web, people suddenly had the choice, not only regarding media, but also regarding consumption. And -surprise!- people do act individually, and the actions are so random, that no correlation holds for more than a couple of weeks. “Multi-optional consumer” is a helpless way to express, that the silos of segmentation no longer make sense. Of course nobody has ever encountered a multi-optional person; on the individual level, people’s behavior is mostly continuous and perfectly consistent; it is just no longer about “what women want”.
The Web also presented for the first time a tool to collect data describing (nearly) everyone on the individual level. However, with trillions of data points on billions of users, every difference between subgroups becomes significant, anyway. Dealing with results like in the example of my colleague’s ethological study mentioned above, the problem comes from taking significance as absolute. No matter how small an effect is, as long as it is significant, it will be considered proven. But statistical inference was designed to suite sample sizes of some ten to some low in the thousands people. It is ill-suited to deal with big data.
The jokes about silly correlations with Google trends are thus totally correct. And this demonstrates also another aspect: significance and hypotheses testing is regarded as static while data remains dynamic. While at some point in time, a correlation of Google trends with other time series might just randomly become significant, it is highly unlikely, that this bogus correlation will survive. Data science, other than classic quantitative research, tends to deal with data in an agile way, which means, that nothing is regarded as fixed. But if we see our data as ephemeral, there is no need to come up with models that we restrict according to fixed proven hypothesis.
So the role of statistics for social science changes. Statistics is now the tool to deal with distributions as phenomena as such rather than just generalizing from small samples to an unknown population. We should use the stream of data as the life-condition in which our models would have to struggle to survive in. Like with biological evolution, we would not expect the assumptions to remain stable. We would rather expect, the boundary conditions to change, and our models would have to adjust; survival of the fittest model means: the fittest for now.
The philosophical justification for inference is the idea of the general comprehensibility of reality. Like St. Augustine we postulate that it is possible to extrapolate from perception (=measurement, data) to the world of things. But like our sensory organs have been evolving, driven by environmental change (and mutations in our genome), we should regard the knowledge we derive from data as “shadow on the cave wall” at best.
This is far better than it sounds: it gives us freedom to explore data rather than just test our made-up hypotheses, that would just perpetuate our presumptions.
Let’s leave statistical testing and significance where it belongs to: Quality assurance, material testing, physical measurements -engineering.
Let’s be honest, and drop it in the humanities.
The Sword and Shield – the metaphor for intelligence in the Soviet world, much stronger than NSA’s key-clutching eagle. Let us fight for our cause with our fiery swords of spirit and blind them with our armour of bright data.
“The NSA is basically applied data science.”
Jason Cust
The European Court of Justice declared the EU directive on data retention void the same day #hartbleed caused the grosset panic about password security the Net had seen so far.
This tells one story:
Get out into the open! Stop hiding! There are no remote places. No privileges will keep your data from the public. No genius open source hack will protect your informational self determination. And spooks, listen: your voyerism is not accepted as OK, not even by the law.
We’re living in a world with more transparency, we need to learn to do intelligence with more transparency too.
Bruce Schneier, #unowned
I was fighting against Europe’s data retention directive, too, and of course I was feeling victorious when it was declared void by the ECJ. But, don’t we know how futile all efforts are, to keep data protected? No cypher can be unbreakable, except the one-time-pad (and that is just of academic interest). No program-code can be proven safe, either – these are mathematical facts. Haven’t you learned how wrong all promisses of security are by #heartbleed? Data protection lulls us into feeling save from data breeches, where we should rather care to make things robust, no matter if the data becomes public intentionally or not.
The far more important battle was won the same week, when the European Parliament decided to protect net neutrality by law. This is the real data protection for me: protecting the means of data production from being engrossed in private.
The intelligence agencies’ damaging the Net by undermining the trust of its users in the integrity of its technology, is a serious thing by inself. However burrying this scandal just under the clutter of civil rights or under constitutional law’s aspects will not do justice. It is of our living in societies in transition from the modern nation state to the after-modern … what ever, liquid community; into McLuhan’s Global Village which is much more serious and much more interesting. We will have to go through the changes of the world and it might not be nice all the time until we come out the other end.
Data begs to be used.
Bruce Schneier, #unowned
In “Snow Crash”, Neal Stephenson imagines a Central Intelligence Corporation, the CIA and NSA becoming a commercial service where everybody just purchases the information they’d need. This was, what came immediately to my mind when I read through the transcript of the talk on “Intelligence Gathering and the Unowned Internet” that was held by the Berkman Center for Internet and Society at Harvard, starring Bruce Schneier, who for every Mathematician in my generation is just the godfather of cryptography. Representatives of the intelligence community were also present. Bruce has been arguing for living “beyond fear” for more than a decade, advocating openness instead of digging trenches and winding up barbed wire. I am convinced, that information does not want to be free (as many of my comrades in arms tend to phrase). However I strongly belief Bruce is right: We can hear data’s call.
The Quantified Self, life-logging, self-tracking – many people making public even their most intimate data, like health, mood, or even our visual field of sight at any moment of our day. An increasingly strong urge to do this rises from social responsibility – health care, climate research, but also from quite profane uses like insurances offering discounts when you let your driving be tracked. So the data is there now, about everything there is to know. Not using it because of fear for privacy would be like having abandond the steam engine and abstinate from the industrialization in anticipation of the climate change.
Speak with us, don’t speak for us.
statement of autonomy of #OccupyWallStreet
Dinosaurs of modern warfare, like the NSA are already escamotating into dragons, fighting their death-match like Smaug at Lake Esgaroth. We have to deal with the dragon, kill it, but this is not, what we should set our political goal to. It will happen anyway.
We should take provision for what real changes we are going to face. We will find ourselves in a form of society that McLuhan would have called re-tribalized, or Tönnies would not have called society at all, but community. In a community, the concept of privacy is usually rather weak. But at the same time, there is no surveillance, no panoptic elevated watchmen who themself cannot be watched. Everyone is every other one’s keeper. Communal vigilance doesn’t sound like fun. However it will be the consequence of after-modern communal structures replacing the modern society. “In the electric world, we wear all mankind as our skin.”, so McLuhan speaketh.
Noi vogliamo cantare l’amor del pericolo.
M5S
Every aspect of life gets quantized, datarized, tangible by computers. Our aggregated models of human behavior get replaced by exact description of the single person’s life and thus the predictions of that person’s future actions. We witness the rise of non-representative democratic forms like occupy assemblies or liquid democracy. What room can privacy have in a world like this whatsoever? So maybe we should concentrate in shaping our data-laden future, rather then protecting a fantasy of data being contained in some “virtual reality” that could be kept separate from our lives.
The data calls us from the depth; let us hear to its voice!
Statistics is often regarded as the mathematics of gambling, and it has some roots in theorizing about games, indeed. But it was the steam engine that really made statistics do something: Thermodynamics, the physics of heat, energy, and gases. Aggregating over huge masses of particles – not observable on an individual level – by means of probability distribution was the paradigm of 19th century science. And this metaphor also was successfully adopted to describing not only masses of molecules, but also masses of people in a mass society.
Particle or Person? This could be someone walking down a street, seeing her friend on the other side, waving her, and then just walking on. Of course it could also be my drawing of a neutron beta-decaying to a proton.For physics, at the end of the 19th century it had become clear, that models reduced on aggregates and distributions where not able to explain many observations that where experimentally proven, like black body radiation or the photo-electric effect. It was Max Planck and Albert Einstein that moved the perspective from statistical aggregates to something that had not been usually taken into consideration: the particle. Quantum physics is the description of physical phenomena on the most granular level possible. By changing focus from the indistinct mass to the individual particle, also the macroscopic level of physics started to make sense again, combining probabilistic concepts like entropy with the behavior of the single particle that we might visualize in a Feynman-diagram.
Special relativity or rather psychohistory?The Web presented for the first time a tool to collect data describing (nearly) everyone on the individual level. The best data came not from intentional research but from cookie-tracking, done to optimize advertising effectiveness. Social Media brought us the next level: semantic data, people talking about their lives, their preferences, their actions and feelings. And people connected with each other, the social graph showed who was talking to whom and about which topics – and how tight social bonds were knit.
We now have the data to model behavior without the need of aggregating. The role of statistics for the humanities changes – like it has done in physics 150 years ago. Statistics is now the tool to deal with distributions as phenomena as such rather than just generalizing from small samples to an unknown population. ‘Data humanity’ would be a much better term for what is usually called ‘data science’ – this I had written after O’Reilly’s Strata conference last year. But I think I might have been wrong as we move from social science to computational social science.
Social research is moving from humanities to science.
Open foresight is a great way to look into future developments. Open data is the foundation to do this comprehensively and in a transparent way. As with most big data projects, the difficult part in open foresight is to collect the data and wrangle it to a form that can actually be processed. While in classic social research you’d have experimental measurements or field notes in a well defined format, dealing with open data is always a pain: not only is there no standard – the meaningful numbers might be found anywhere in your source and be called arbitrarily; also the context is not given by some structure that you’d have imposed into your data in advanced (as we used to do it in our hypothesis-driven set-ups).
In the last decade, crowdsourcing has proven to be a remedy to dealing with all kinds of challenges that are still to complex to be fully automatized, but which are not too hard to be worked out by humans. A nice example is zooniverse.org featuring many “citizen science projects”, from finding exoplanets or classifying galaxies, to helping to model global climate history by entering historic ships’ log data.
Climate change caused by humanity might be the best defended hypothesis in science; no other theory had do be defended against more money and effort to disprove it (except perhaps evolution, which has do fight a similar battle about ideology). But apart from the description, how climate will change and how that will effect local weather conditions, we might still be rather little aware of the consequences of different scenarios. But aside from the effect of climate-driven economic change on people’s lives, the change of economy itself cannot be ignored when studying climate and understand possible feedback loops that might or might not lead into local or global catastrophe.
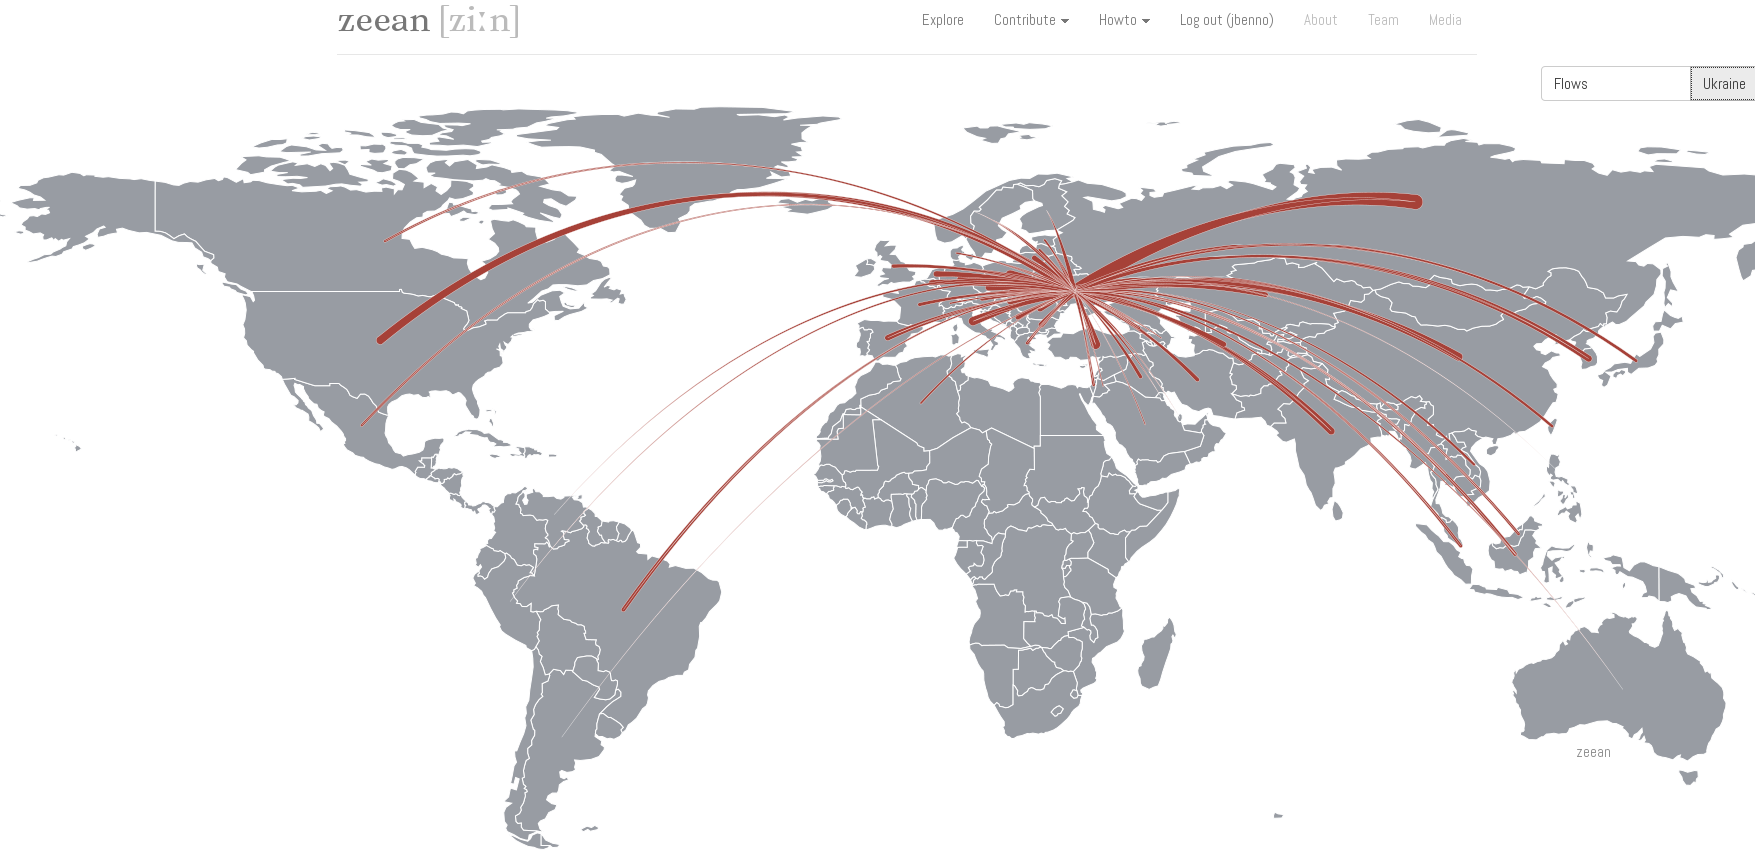
Zeean.net is an open data / open source project aiming at the economic impact of climate change. Collecting data is crowdsourced – everyone can contribute key indicators of geo-economic dependency like interregional and domestic flow of supply and demand in an easy “Wikipedia-like” way. And like Wikipedia, the validation is done by crowd-crosscheck of registered users. Once data is there, it can be fed into simulations. The team behind Zeean, lead by Anders Levermann at Potsdam Institute for Climate Impact Research is directly tied into the Intergovernmental Panel on Climate Change IPCC, leading research on climate change for the UN and thus being one of the most prominent scientific organizations in this field.
A first quick glance on the flows of supply shows how a conflict in the Ukraine effect the rest of the world economically.The results are of course not limited to climate. If markets default for other reasons, the effect on other regions can be modeled in the same way.
So I am looking forward to the data itself being made public (by then brought into a meaningful structure), we could start calculating our own models and predictions, using the powerful open source tools that have been made available during the last years.
An algorithm is a structured description on how to calculate things. Some of the most prominent examples of algorithms have been around for more than 2500 years like Euklid’s algorithm that gives you the greatest common divisor or Erathostenes’ sieve to give you all prime numbers up to a given maximum. These two algorithms do not contain any kind of value judgement. If I define a new method for selecting prime numbers – and many of those have been publicized! – every algorithm will come to the same solution. A number is prime or not.
But there is a different kind of algorithmic processes, that is far more common in our daily life. These are algorithms that have been chosen to find a solution to some task, that others would probably have done in a different way. Although obvious value judgments done by calculation like credit scoring and rating immediately come to our mind, when we think about ethics in the context of calculations. However there is a multitude of “hidden” ethic algorithms that far more pervasive.
On example that I encountered was given by Gary Wolf on the Quantified Self Conference in Amsterdam. Wolf told of his experiment in taking different step-counting gadgets and analyzing the differing results. His conclusion: there is no common concept of what is defined as “a step”. And he is right. The developers of the different gadgets have arbitrarily chosen one or another method to map the data collected by the gadgets’ gyroscopic sensors into distinct steps to be counted.
So the first value judgment comes with choosing a method.
Many applications we use work on a fixed set of parameters – like the preselection of a mobile optimized CSS when the web server encounters what it takes for a mobile browser. Often we get the choice to switch to the “Web-mode”, but still there are many sites that would not allow our changing the view unless we trick the server into believing that our browser would be a “PC-version” and not mobile. This of course is a very simple example but the case should be clear: someone set a parameter without asking for our opinion.
The second way of having to deal with ethics is the setting of parameters.
A good example is given by Kraemer et. al in their paper. In medical imaging technologies like MRI, an image is calculated from data like tiny elecromagnetic distortions. Most doctors (I asked some explicitly) take these images as such (like they have taken photographs without much bothering about the underlying technology before). However, there are many parameters, that the developers of such an algorithmic imaging technology have predefined and that will effect the outcome in an important way. If a blood vessel is already clotted by arteriosclerosis or can be regarded still as healthy is a typical decision where we would like be on the safe side and thus tend to underestimate the volume of the vessel, i.e. prefer a more blurry image, while when a surgeon plans her cut, she might ask for a very sharp image that overestimates the vessel’s volume by trend.
The third value judgment is – as this illustrates – how to deal with uncertainty and misclassification.
This is what we call alpha and beta errors. Most people (especially in business context) concentrate on the alpha error, that is to minimize false positives. But when we take the cost of a misjudgement into account, the false negative often is much more expensive. Employers e.g. tend to look for “the perfect” candidate and by trend turn down applications that raise their doubts. By doing so, it is obvious that they will miss many opportunities for the best hire. The cost to fire someone that was hired under false expectations is far less than the cost of not having the chance in learning about someone at all – who might have been the hidden beauty.
The problem of the two types of errors is, you can’t optimize both simultaneously. So we have to make a decision. This is always a value judgment, always ethical.
All three judgments – What method? What parameters? How to deal with misclassification? – are more often than not made implicitly. For many applications, the only way to understand these presumptions is to “open the black box” – hence to hack.
Given all that, I would like to demand three points of action:
– to the developers: you have to keep as many options open as possible and give others a chance in changing the presets (and customers: you must insist of this, when you order the programming of applications);
– to the educational systems: teach people to hack, to become curious about seeing behind things.
– to our legislative bodies: make hacking things legal. Don’t let copyright, DRM and the like being used against people who re-engineer things. Only what gets hacked, gets tested. Let us have sovereignty over the things we have to deal with, let us shape our surroundings according to our ethics.
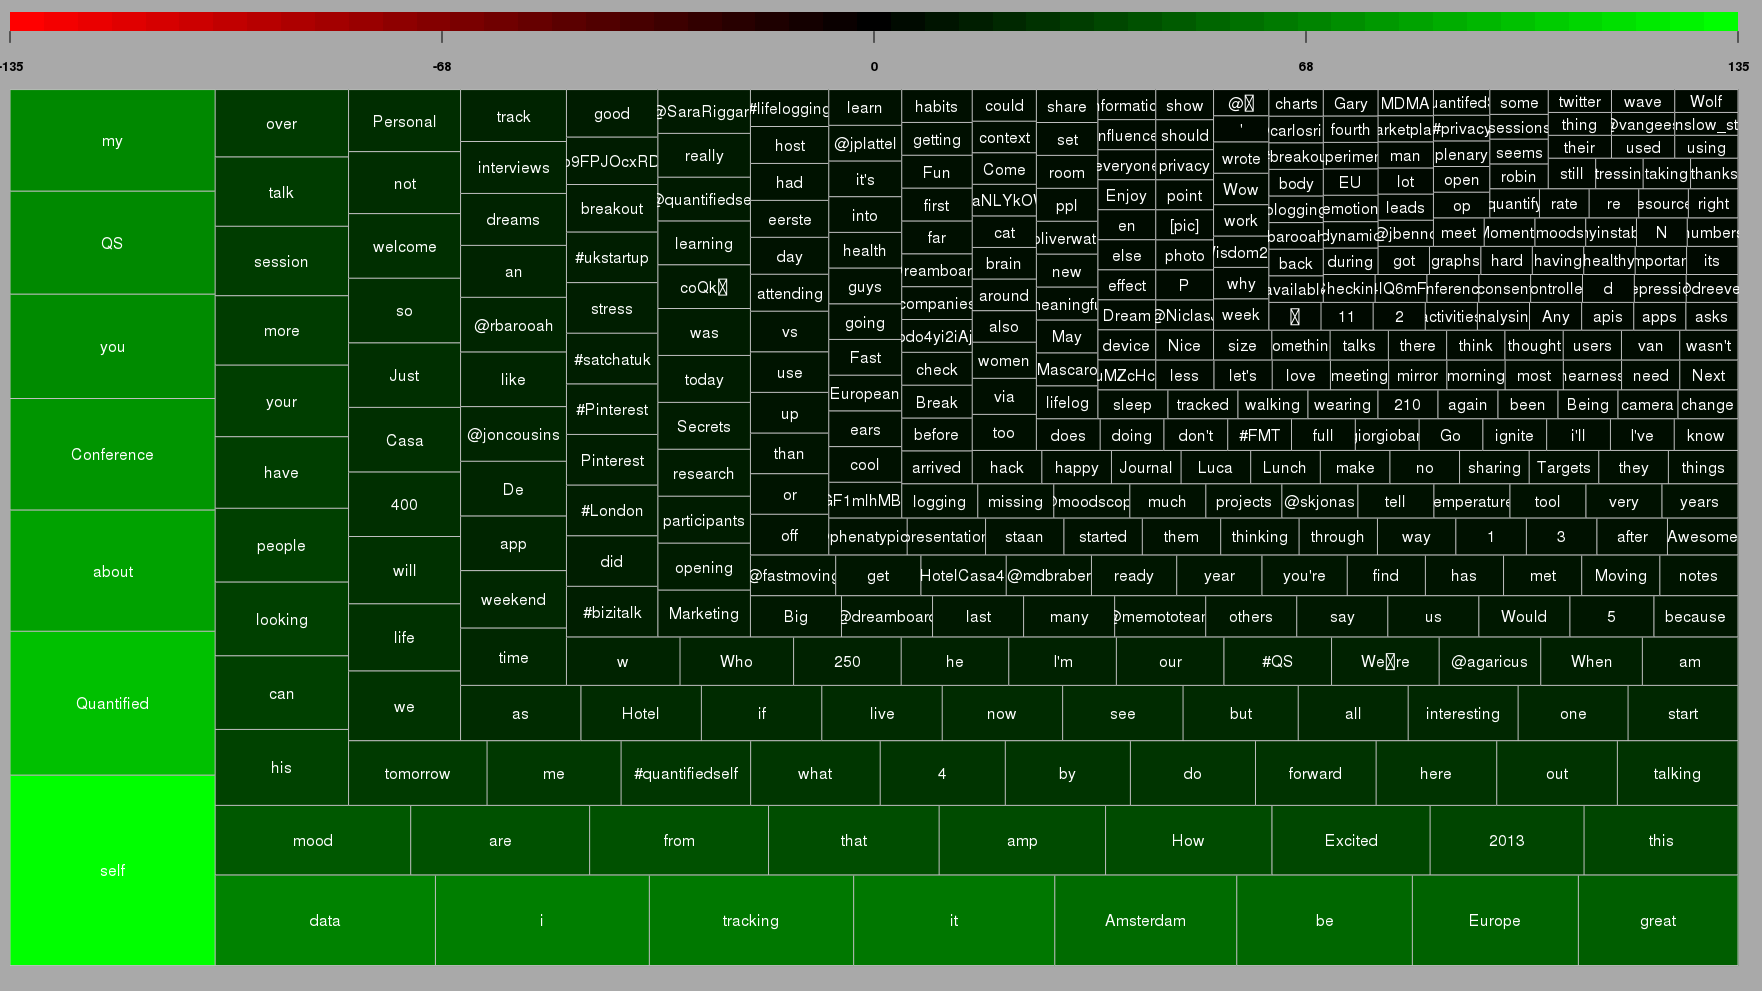
The most common words in the Tweets tagged #qseu13 posted over the weekend. Here you find another visualization: [Wordcloud]Last weekend the 4th Conference on Quantified Self took place in Amsterdam. Quantified Self is a movement or direction of thought that summarizes many aspects of datarization of the live of people by themselves. The term “QS” was coined by Kevin Kelly and Gary Wolf, who hosted the conference. Thus it cannot be denied that some roots of QS lie in the Bay-Area techno-optimistic libertarianism best represented by Wired. However a second root stems from people who started quantifying themselves to better deal with manifest health problems – be it polar disorder, insomnia or even Parkinson and cancer. In both aspects the own self acts as object and subject to first analyze and then shape itself. Both have to do with self-empowerment and acting on our human condition.
“For Quantified Self, ‘big data’ is more ‘near data’, data that surrounds us.”
Gary Wolf
Quantified Self can be viewed as taking action to reclaim the collection of personal data, not because of privacy but because of curiosity. Why not take the same approach that made Google, Amazon and the like so successful and use big data on yourself?
Tweets per hour during the conference weekend. Of course our physical life finds its expression in data ….Since many QS-people use off-the-shelf gadgets, it is not only important to get full access to the data collected but also transparency on the algorithms that are implemented within. Like Gary Wolf pointed out, if two step-counters vary in their results, it tells us one thing: there is no common concept of ‘What is a step?’. These questions of algorithm ethics become more pressing as our daily life becomes more and more dependent on algorithms but we would usually not have a chance to see into that “black box” and the implicit value judgements that are programmed into it. (I just gave a talk on that specific topic at re:publica last Monday which I will post here later). I think that in no field the problems of algorithms taking ethic decisions becomes more obvious than when data deals immediately with yourself.
What self is there to be quantified?
What is the “me”? What is left, when we deconstruct what we are used to regard as “our self” into quanta? Is there a ghost in the shell? The idea of self-quantification implies an objective self that can be measured. With QS, the rather abstract outcomes of neuroscience or human genetics become tangible. The more we have quantitatively deconstructed us, the less is left for mind/body-dualism.
On est obligé d’ailleurs de confesser que la Perception et ce qui en dépend, est inexplicable par des raisons mécaniques. G. W. Leibniz
As a Catholic, I was never fond that our Conscious Mind would just be a Mechanical Turk. As a mathematician, I feel deep satisfaction in seeing our world including my very own self becoming datarizable – Pythagoras was right, after all! This dialectic deconstruction of suspicious dualism and materialistic reductionism was discussed in three sessions I attended – Whitney Boesel’s “The missing trackers”, Sarah Watson’s “The self in data” and Natasha Schüll’s “Algorithmic Selfhood”.
“Quantifying yourself is like art: constructing a kind of expression.”
Robin Barooah
Many projects I saw at #qseu13 can be classified as art projects in their effort to find the right language to express the usually unexpresseble. But compared to most “classic” artists I know, the QS-apologetes are far less self-centered (sounds more contradictory than it is) and much more directed to in changing things by using data to find the sweetspot to set their levers.
What starts with counting your steps ends consequently in shaping yourself with technological means. Enhancing your bodily life with technology is the definition of becoming a Cyborg, as my friend Enno Park points out. Enno got Cochlea-implants to overcome his deafness. He now advocates for Cyborg rights – starting with his right to hack into his implants. Enno demands his right to tweak the technology that became part of his head.
Self-hacking will become as common as taking Aspirin to cure a headache. Even more: we will have to get literate in the quantification techniques to keep up with others that would anyway do it for us: biometric security systems, medical imaging and auto-diagnosis. To express ourselves with our data will become part of our communication culture as Social Media have today. So there will be not much of an alternative left for those who have doubts about quantifying themself. “The cost of abstention will drive people to QS.” as Whitney Boesel mentioned.
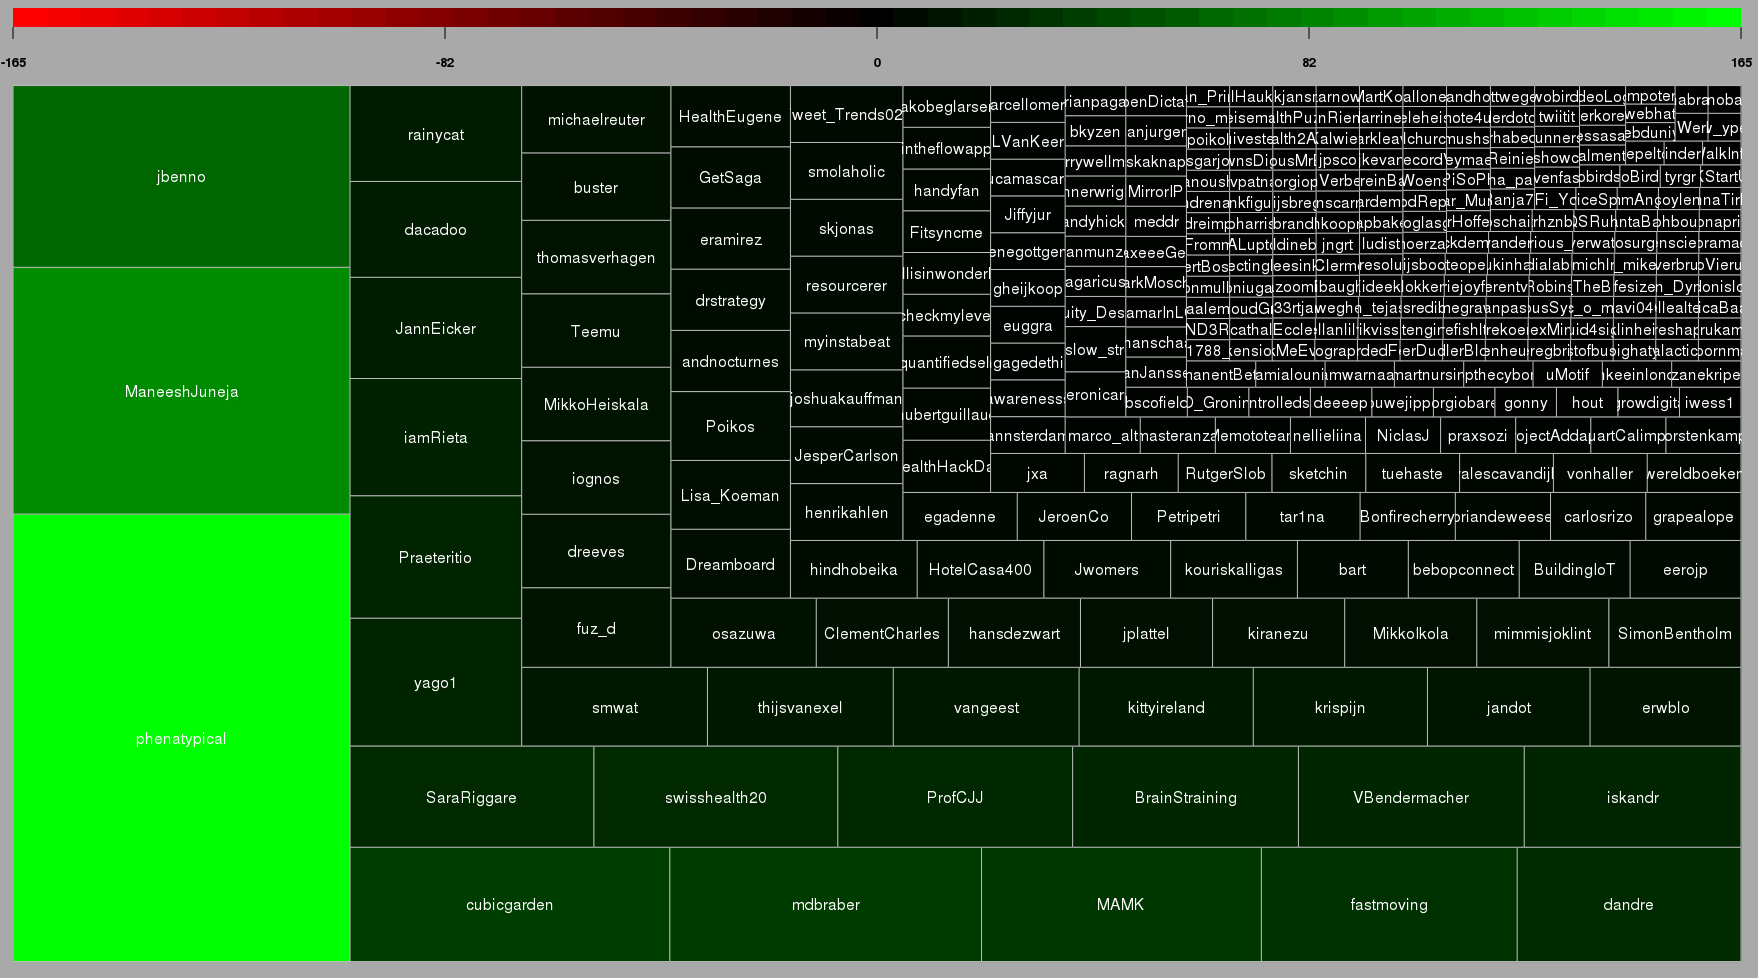
Top Twitterers for #qseu13-conference: 1) Whitney Erin Boesel, 2) Maneesh Juneja 3) that’s me 😉
Crystals like the flourite, calcite, or garnet here show properties, that can easily be expressed in mathematical terms. This inspired the legendary Pythagoras an his students to postulate the whole world to be genuinly mathematical. Social behavior seams to be random, however data science can help us detect laws and patterns, that can be expressed in mathematical functions like the shape of the crystals.Our senses are adapted to detect of our environment, what is necessary for our survival. In that way, evolution turns St. Augustin’s postulate of our world as being naturally conceivable to our minds from its head onto the feet. What we define as laws of nature are just the mostly linear correlations and the most regular patterns we could observe in our world.
When I had my first computer with graphical capabilities (an Atari Mega ST) in 1986, I, like everybody else, started hacking fractals. Rather simple functions produced remarkably complex and unpredictable visualizations. It was clear, that there might be many more patterns and laws to be discovered in nature, as soon as we could enhance our minds and senses with the computer – structures and patterns way to subtle to be recognised with our unarmed eye. In that way, the computer became, what the microscope or the telescope hat been to the researchers at the dawn of modernity: an enhancement of our mind and senses.
“Number is an extension and separation of our most intimate and interrelating activity, our sense of touch” (McLuhan)
The origin of the word digital stems from digitus, Latin for the finger. Counting is to separate, to cluster and summarize – as Beda the Venerable did with his fingers when he coined the term digit. With the Net, human behavior became trackable in unprecedented totality. Our lives are becoming digitized, everything we do becomes quantified that is, put in quants.
With the first graphically capable computers, we could suddenly experience the irritating complexity of the fractals. Now we can put almost anything into our calculations – and we find patterns and laws everywhere.
What is quantified, can be fed into algorithms. Algorithms extend our mind into the realm of data. We are already used to algorithms recommending us merchandise, handling many services at home or in business, like supporting our driving a car by navigating us around traffic jams. With data based design and innovation processes, algorithms take part in shaping our things. Algorithms also start making ethical judgments – drones that decide autonomously on the taking or sparing the life of people, or – less dramatic but very effectiv though – financial services granting us a better or worse credit score. We have already mentioned “Posthuman Advertising” earlier.
The world is not only recognisable, the world in every detail is quantifiable. Our datarized word is the final victory of the Pythagoreans – all and everything to be expressed in mathematics. Data science in this way leads us to a similar revolution of mind, than that of the time of Copernicus, Galileo and Kepler.
Mathematics is usually not regared as a science but as part of philosophy – although it has some relation to the “real world” – as shown in this 18 century cut.There is a reason why we differentiate science and the humanities. And although sociology, experimental psychology and even history nowadays deploy many scientific methods, the difference is still fundamental. Humantites deal with correlations; the causalities are way further speculative than the “laws of nature” that are formulated in physics or chemistry. Also the data that supports social research is always and inherrently biased, no matter how much care we take in sampling, representativeness and other precautions we might take.
In her remarkable talk at Strataconf, Kate Crawford warned us, that we should always suspect our “Big Data” sources as highly biased, since the standard tools of dealing with samples (as mentioned above) are usualy neglected when the data is collected.
Nevertheless, also the most biased data gives us valuable information – we just have to be careful with generalizing. Of course this is only relevant for data relating to humans using some kind of technology or service (like websites collecting cookie-data or people using some app on their phone). However, I am anyway much more interested in the humanities’ side of data: Data describing human behavior, data as an aditional dimension of people’s lives.
Taken all this, I suggest to call this field of behavior data “Data Humanities” rather than “Data Science”.
Our brain is wired to experiencing the world as one consistent model of reality. New data we interpret either as confirmation of the model or as an update to replace one of its parameters with a new value. Our sensory organs also reduces the incoming stimuli, drop most of the impressions, preprocess what is identified as signals to simple patterns that are propagated to our mind. What we remember as the edge of our table – a straight line, limiting the surface – was in fact received as a fine grid of multicoloured pixels by our retina. For sake of saving computation and storage power, and to keep a stable, consistent view, we forsake the richness of information. And we use to build our data bases to work exactly that way.
One of the realy disruptive shifts in our business is imo to break this paradigm: “Make your source of truth immutable.” Nathan Marz (who has just yesterday left the Twitter team) tells us to have a base layer of incoming data. Nothing here gets updated or changed. New records are just attached. From such an immutable data source, we can reconstruct the state of our data set at any given point of time in the past; even if someone messes with the database, we could roll back without the need to reset everything. This rather unstructured worm is of course not fit to get access to information with low latency. In Marz’ paradigm it is the “source of truth”, is a repository to feed into a second level of more “classic” data bases that provides precalculated, prepopulated tables that can be accessed at real time.
What Nathan Marz advocates as a way to make data bases more tolerant against human fault entails in fact a deep, even philosophical perspective. With the classic database we would keep master data and transaction data in different tables. We would regard a master record as something that should provide one consistent view on the object recorded. Take a clients data base of some retailer: Address or payment information we would expect to be a static property of the client, to be kept “up to date” – if the person moves, we would update the record. Other information we would even regard as unchangeable: Name, gender or birthday for example. This is exactly how we would be looking at the world if we had remained at the state of the naive phenomenology of the early modern ages. Concepts like “identity” of a human being reflect this integral perspective of an object with master properties – ideas like “character” (individual or even bound to ethnicity or nation) stem from this taking an object as in reality being independent from the temporal state of data that we could comprehend. (Please excuse my getting rather abstract now.)
Temporal logic was developed not in philosophy but rather in computer science. The idea is, that those apodictical clauses of “true” or “false” – tertium non datur” – that we are used to deal with in propositional calculus since the time of the ancient Greeks, would not be correctly applicable to real world systems like people interacting with other in time. – The “classic” example would be a sentence like “I am hungry” that would never necessaryly be true or false because it would depend on the specific circumstances at that point in time when I would have stated it; nevertheless it should be regarded as a valid property to describe me at that time.
In such way, the immutable database might not reflect our gut feeling about reality, but it certainly is a far more accurate “source of truth”, and not only because it is more tolerant against human operators tampering with the data.
With the concept of one immutable source of truth, this “master record” is just a view on the data at one given point in time. We would finally have “the forth dimension” in our data.
“My market research indicates that 50% of your customers are above the median age. But the shocking discovery was that 50% were below the median age.”
(Dilbert; read it somewhere, cant remember the source)
It was funny to see everyone at O’Reilly’s Strata Conference talk about data science and hear just the dinosaurs like Microsoft, Intel or SAP still calling it “Big Data”. Now, for me, too, data science is the real change; and I tell you, why:
What always annoyed me when working with market researchers: you never get an answer. All you get is a description of the sample. Drawing samples was for sure a difficult task 50 years ago. You had to send interviews arround, using a kish grid (does anyone remember this – at least outside Germany?). The data had to be coded into punch cards and clumsy software was used to plot elementary descriptives from ascii-letters. If you still use SPSS, you might know what I am talking about. When I studied statistics in the early 90s, testing hypotheses was much more important than predictions, and visualisaton was not invented yet. The typical presentation of a market researcher would thus start with describing the sample (50% male, 25% from 20 to 39 years, etc.) and in the end, they would leave the client with some more or less trivialy aggregated Excel-Tables.
When I became in charge of pricing ad breaks of a large TV network, all this research was useless for my purposes. My job required predicting the measured audiences of each of the approximately 40 ad breaks for every of our four national stations six weeks in advance. I had to make the decission in real time, no matter how accurate the information I calculated the risks on would have been.
Market research is bad in supporting real time management decissions. So managers tend to decide on their “gut feelings”. But the framework has changed. The last decade brought to us the possibility to access huge data sets with low latency and run highly multivariate models. You cant do online advertising targeting based on gut feelings.
But most market researchers would still argue that the analytics behind ad targeting are not market research because they would just rely on probabilistic decissions, on predictions based on correlations rather than causality. Machine learning does not test a hypothesis that was derived from a theoretical construct of ideas. It identifies patterns and the prediction would be taken as accurate just if the effect on the ROI would be better then before.
I can very well live with the researchers keeping to their custom as long as I may use my data to do the predictions I need. When attending Strata Conference, I realized this deep paradigm shift from market research, describing data as its own end to data science, getting to predicitons.
Maybe it is thus a good thing to differentiate between market research and data science.
(This is the first in a row of posts on our impressions at Strata this year; the others will follow quickly …)
In computer science we have learned that we can do with non-linear models only in very unlikely examples. Not only our machines – also our minds are not capable to foresee non-linear developments. One of the achievements of Mandelbrot’s works and the ‘Chaos Theory’ is that we now better understand how this works and that we truly have no alternative.
You might have wondered, why the phenomenon of the Hype has such a distinct form, that consultancies like Gartner can even draw a curve – the famous “Garnter Hype Cycle of Emerging Technologies“. We will try to give a simple explanation.
Fig. 1: the development from inventing a new technology to reaching the market potential can take more or less time.If a new technology or business model is invented, it is often possible to estimate the market potential in the long run. There are futurists that come up with the social and behavioural changes the new technology will entail and analysts that calculate the economical consequences. And now enter the scenarios. The analysts will estimate the range of time in which the expected development would take place – a “best case” with no resistance and a “worst case” with high persistence of the existing markets (Fig. 1)
Even if we don’t really believe the “best case”, it is wise to prepare for the changes, a “better case” would deliver. We start observing the market figures. We see that the new technology is quickly adopted by our peers (or those how we would love to be peer with …). We see that the new technology gets funding, a valuation that reflects the expected market potential but is effective today.
In reality, it is not that simple to produce and distribute novel technologies or services to mass markets. This requires more skills than just inventing it. There is usually some economy of scale in production and logistics, time to build business relationships and negotiate sales contracts.
Fig. 2: We want to be on the safe side, thus we take the “best case” scenario (and at the same time we experience that the market potential of the new technology is truly there).So we always tend to overestimate the short term effect. And after we recognise that the thing was over hyped, we feel disappointed and the expectations are adjusted accordingly – the “valley of tears” through almost every start-up has to go. (Fig. 2)
Fig. 3: all linear projections overestimate the short term effect and underestimate the longterm effect.But this adjusting of our expectations bears more risk than the over hypeing: by projecting the slower growth up to limit of our expected the market potential, we completely underestimate the long-run effect, as you can see in the “belly” that is caught between the sections of the blue arrow and the red curve in Fig. 3.
Why do we find this sigmoid shape of the growth curve? First: the “hype” does normally not happen in the sales numbers of our technology; the “early adopters” are just too few to make a real impact. And after having said this: it is the law of decreasing marginal costs – every new piece is produced (or resp. sold) easier than the lots we had produced before. Just very shortly before hitting the ceiling of the market potential, we see a saturation – diminishing marginal profits when we “reach the plateau”.
We have experienced this with many industries during the last decades: the newspaper publishers – very early experimenting with the new, digital distribution but then completely failing to be ready when time was due; same with the phone makers (we will come to this example later), and we will see this happen again: electric cars, head-up displays, 3d-printing, market research, just to name a few. The astonishing fact is that all these disruptions have already taken place. It is just the linear projections and bad scenario planning that prevents us from taking the right decisions to cope with them.
Chess is a game that does not depend from chance. Every move can be exactly valuated mathematically, and in theory we can calculate the optimal strategy for both colors from any arbitrary position up to the end of the match.
Interestingly there is hardly any “intelligent” chess program. Almost everything that was coded during the last 40 years, solves the match with brute force: just calculating the results for almost every path for a few steps in advance and then choosing a move that is optimal in short term. This works, because the computer can crunch millions of variations after every move. However this can hardly be called strategic.
Regarding foresight in economy, culture, society, etc., we are used to scenarios: we play through all possible developments by changing on parameter at a time. Most prominent is the “Worst Case Scenario”, where we just put all controls of our model to the minimum.
Like in chess, we defeat apparently the most complex problems with this mindless computation. What we will never get are insights on disruptions, epochal changes, revolutions.
Disruptions occur at those points where the curve bends. Mathematically speaking, “bend” means, that the function that describes the development has no derivative at this point, thus it changes its direction spontaneously. If we imagine a car driving along the so far smooth curve, the driver will be caught in complete surprise by the bend in the track.
In reality, these bends almost never happen without some augury. Disruptions evolve by the transposition of processes. We might think of the processes as oscillations, like waves. Not every new wave that adds its influence to the development we have in focus, will cause a noticeable distortion. Many such processes tune into the main waves of the development unrecognized.
Critical are those distortions, new processes, that occur and start to build up with the existing development, like a feedback loop, to finally dominate the development completely.
The art of foresight is to identify exactly these waves that have the potential to build up and break through the system.
We will discuss some examples of this occasionally.


![[Wordcloud]](http://beautifuldata.net/wp-content/uploads/2013/05/wordcloud.png)