2014 highlight (1): Statistical Learning course by Hastie & Tibshirani

What I like most about the R and Python developer and user communities, is their incredible openness and generosity. One of the finest examples in the past year was the online course “Statistical Learning” taught by Stanford professors Trevor Hastie and Rob Tibshirani.

statlearning_screenshot

In this MOOC they explain very understandably (even for beginners) the basics of statistical modeling (or machine learning) techniques such as linear, polynomial and logistic regression, smoothing splines, Ridge regression, Lasso, Generalized Additive Models, various methods for classification (Classification Trees to random forests) and also unsupervised learning methods.

But the highlights of this course are the R labs between all units. In these sessions, the statistical theory is supplemented with many practical examples. It’s really fantastic to hear the authors explain and teach the (very essential) R packages they wrote themselves. For me, the course was also an impetus to learn even more about knitr. Especially if you’re used to IPython notebook, this combination of code and output can be very intuitive and useful. Even months after going through the course, I refer to my lab R code (see also here) when I need some quick templates for common statistical modelling tasks. I really liked the strong focus on cross validation methods – many basic courses on statistics focus only on the methods and not on how to estimate how well you’re predicting.

ISL Cover 2
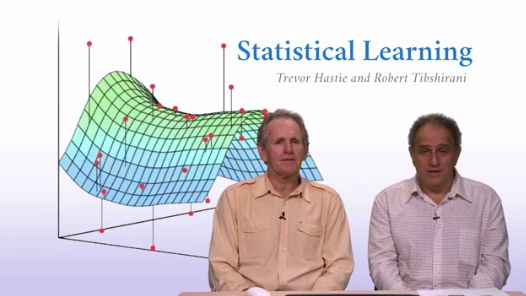
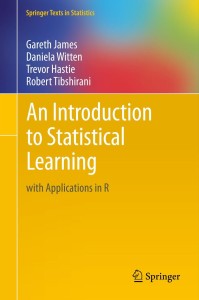
The course is based on the textbook “Introduction to Statistical Learning” (or short: ISL, download here) Hastie and Tibshirani wrote together with Gareth James and Daniela Witten. If you want to dive even deeper into the subject, you can also work through the more advanced work “Elements of Statistical Learning” (ESL, download).

So, if one of your New Year resolutions for 2015 is, learning how to do more with R, you should definitively take a look at this course. The next free class is starting on January 19.

Continue with part 2 of the 2014 highlights.

Analyzing VC investment strategies with Crunchbase data

If you look at the investments in Big Data companies in the last few years, one thing is obvious: This is a very dynamic and fast growing market. I am producing regular updates of this network map of Big Data investments with a Python program (actually an IPython Notebook).

But what insights can be gained by directly analyzing the Crunchbase investment data? Today I revved up my RStudio to take a closer look at the data beneath the nodes and links.

Load the data and required packages:

library(reshape)
library(plyr)
library(ggplot2)
data <- read.csv('crunchbase_monthly_export_201403_investments.csv', sep=';', stringsAsFactors=F)
inv <- data[,c("investor_name", "company_name", "company_category_code", "raised_amount_usd", "investor_category_code")]
inv$raised_amount_usd[is.na(inv$raised_amount_usd)] <- 1

In the next step, we are selecting only the 100 top VC firms for our analysis:

inv <- inv[inv$investor_category_code %in% c("finance", ""),]
top <- ddply(inv, .(investor_name), summarize, sum(raised_amount_usd))
names(top) <- c("investor_name", "usd")
top <- top[order(top$usd, decreasing=T),][1:100,]
invtop <- inv[inv$investor_name %in% top$investor_name[1:100],]

Right now, each investment from a VC firm to a Big Data company is one row. But to analyze the similarities between the VC companies in term of their investment in the various markets, we have to transform the data into a matrix. Fortunately, this is exactly, what Hadley Wickham’s reshape package can do for us:

inv.mat <- cast(invtop[,1:4], investor_name~company_category_code, sum)
inv.names <- inv.mat$investor_name
inv.mat <- inv.mat[,3:40] # drop the name column and the V1 column (unknown market)

These are the most important market segments in the Crunchbase (Top 100 VCs only):

inv.seg <- ddply(invtop, .(company_category_code), summarize, sum(raised_amount_usd))
names(inv.seg) <- c("Market", "USD")
inv.seg <- inv.seg[inv.seg$Market != "",]
inv.seg$Market <- as.factor(inv.seg$Market)
inv.seg$Market <- reorder(inv.seg$Market, inv.seg$USD)
ggplot(inv.seg, aes(Market, USD/1000000))+geom_bar(stat="identity")+coord_flip()+ylab("$1M USD")

plot of chunk unnamed-chunk-4

What’s interesting now: Which branches are related to each other in terms of investments (e.g. VCs who invested in biotech also invested in cleantech and health …). This question can be answered by running the data through a K-means cluster analysis. In order to downplay the absolute differences between the categories, I am using the log values of the investments:

inv.market <- log(t(inv.mat))
inv.market[inv.market == -Inf] <- 0

fit <- kmeans(inv.market, 7, nstart=50)
pca <- prcomp(inv.market)
pca <- as.matrix(pca$x)
plot(pca[,2], pca[,1], type="n", xlab="Principal Component 1", ylab="Principal Component 2", main="Market Segments")
text(pca[,2], pca[,1], labels = names(inv.mat), cex=.7, col=fit$cluster)

plot of chunk unnamed-chunk-5

My 7 cluster solution has identified the following clusters:

  • Health
  • Cleantech / Semiconductors
  • Manufacturing
  • News, Search and Messaging
  • Social, Finance, Analytics, Advertising
  • Automotive & Sports
  • Entertainment

The same can of course be done for the investment firms. Here the question will be: Which clusters of investment strategies can be identified? The first variant has been calculated with the log values from above:

inv.log <- log(inv.mat)
inv.log[inv.log == -Inf] <- 0
inv.rel <- scale(inv.mat)

fit <- kmeans(inv.log, 6, nstart=15)
pca <- prcomp(inv.log)
pca <- as.matrix(pca$x)
plot(pca[,2], pca[,1], type="n", xlab="Principal Component 1", ylab="Principal Component 2", main="VC firms")
text(pca[,2], pca[,1], labels = inv.names, cex=.7, col=fit$cluster)

plot of chunk unnamed-chunk-6

The second variant uses scaled values:

inv.rel <- scale(inv.mat)

fit <- kmeans(inv.rel, 6, nstart=15)
pca <- prcomp(inv.rel)
pca <- as.matrix(pca$x)
plot(pca[,2], pca[,1], type="n", xlab="Principal Component 1", ylab="Principal Component 2", main="VC firms")
text(pca[,2], pca[,1], labels = inv.names, cex=.7, col=fit$cluster)

plot of chunk unnamed-chunk-7

Crowdsourcing Science

Open foresight is a great way to look into future developments. Open data is the foundation to do this comprehensively and in a transparent way. As with most big data projects, the difficult part in open foresight is to collect the data and wrangle it to a form that can actually be processed. While in classic social research you’d have experimental measurements or field notes in a well defined format, dealing with open data is always a pain: not only is there no standard – the meaningful numbers might be found anywhere in your source and be called arbitrarily; also the context is not given by some structure that you’d have imposed into your data in advanced (as we used to do it in our hypothesis-driven set-ups).

In the last decade, crowdsourcing has proven to be a remedy to dealing with all kinds of challenges that are still to complex to be fully automatized, but which are not too hard to be worked out by humans. A nice example is zooniverse.org featuring many “citizen science projects”, from finding exoplanets or classifying galaxies, to helping to model global climate history by entering historic ships’ log data.

Climate change caused by humanity might be the best defended hypothesis in science; no other theory had do be defended against more money and effort to disprove it (except perhaps evolution, which has do fight a similar battle about ideology). But apart from the description, how climate will change and how that will effect local weather conditions, we might still be rather little aware of the consequences of different scenarios. But aside from the effect of climate-driven economic change on people’s lives, the change of economy itself cannot be ignored when studying climate and understand possible feedback loops that might or might not lead into local or global catastrophe.

Zeean.net is an open data / open source project aiming at the economic impact of climate change. Collecting data is crowdsourced – everyone can contribute key indicators of geo-economic dependency like interregional and domestic flow of supply and demand in an easy “Wikipedia-like” way. And like Wikipedia, the validation is done by crowd-crosscheck of registered users. Once data is there, it can be fed into simulations. The team behind Zeean, lead by Anders Levermann at Potsdam Institute for Climate Impact Research is directly tied into the Intergovernmental Panel on Climate Change IPCC, leading research on climate change for the UN and thus being one of the most prominent scientific organizations in this field.

A first quick glance on the flows of supply shows how a conflict in the Ukraine effect the rest of the world economically.
The results are of course not limited to climate. If markets default for other reasons, the effect on other regions can be modeled in the same way.
So I am looking forward to the data itself being made public (by then brought into a meaningful structure), we could start calculating our own models and predictions, using the powerful open source tools that have been made available during the last years.

Trending Topics at Strata Conferences 2011-2014

To fill the gap until this year’s Strata Conference in Santa Clara, I thought of a way to find out trends in big data and data science. As this conference should easily be the leading edge gathering of practitioners, theorists and followers of big data analytics, the abstracts submitted and accepted for Strataconf should give some valuable input. So, I collected the abstracts from the last Santa Clara Strata conferences and applied some Python nltk magic to it – all in a single IPython Notebook, of course.

Here’s a look at the resulting insights. First, I analyzed the most frequent words, people used in their abstracts (after excluding common English language stop words). As a starter, here’s the Top 20 words for the last four Strata conferences:

Strata_Words_2011 Strata_Words_2012 Strata_Words_2013 Strata_Words_2014

This is just to check, whether all the important buzzwords are there and we’re measuring the right things here: Data – check! Hadoop – check! Big – check! Business – check! Already with this simple frequency count, one thing seems very interesting: Hadoop didn’t seem to be a big topic in the community until 2012. Another random conclusion could be that 2011 was the year where Big Data really was “new”. This word loses traction in the following years.

And now for something a bit more sophisticated: Bigrams or frequently used word combinations:

2011
Strata_Bigrams_2011
2012
Strata_Bigrams_2012
2013
Strata_Bigrams_2013
2014
Strata_Bigrams_2014

Of course, the top bigram through all the years is “big data”, which is not entirely unexpected. But you can clearly see some variation among the Top 20. Looking at the relative frequency of the mentions, you can see that the most important topic “Big Data” will probably not be as important in this years conference – the topical variety seems to be increasing:

Strata_Bigrams

Looking at some famous programming and mathematical languages, the strong dominance of R seems to be broken by Python or IPython (and its Notebook environment) which seems to have established itself as the ideal programming tool for the nerdy real-time presentation of data hacks. \o/

Strata_Lang

Another trend can be seen in the following chart: Big Data seems to become more and more faceted over the years. The dominant focus on business applications of data analysis seems to be over and the number of different topics discussed on the conference seems to be increasing:

Strata_Fields

Finally, let’s take a more systematic look at rising topics at Strata Conferences. To find out which topics were gaining momentum, I calculated the relative frequencies of all the words and compared them to the year before. So, here’s the trending topics:

Strata_Trends_2012 Strata_Trends_2013 Strata_Trends_2014

These charts show that 2012 was indeed the “Hadoop-Strata” where this technology was the great story for the community, but also the programming language R became the favorite Swiss knife for data scientists. 2013 was about applications like Hive that run on top of Hadoop, data visualizations and Google seemed to generate a lot of buzz in the community. Also, 2013 was the year, data really became a science – this is the second most important trending topic. And this was exactly the way, I experienced the 2013 Strata “on the ground” in Santa Clara.

What will 2014 bring? The data suggests, it will be the return of the hardware (e.g. high performance clusters), but also about building data architectures, bringing data know-how into organizations and on a more technical dimension about graph processing. Sounds very promising in my ears!

Identifying trends in the German Google n-grams corpus (Tutorial)

A lot of people still have a lot of respect for Hadoop and MapReduce. I experience it regularly in workshops with market researchers and advertising people. Hadoop’s image is quite comparable with Linux’ perceived image in the 1990s: a tool for professional users that requires a lot of configuration. But in the same way, there were some user-friendly distributions (e.g. Suse), there are MapReduce tools that require almost no configuration.

One favorite example is the ease and speed, you can do serious analytical work on the Google n-grams corpus with Hive on Amazon’s Elastic MapReduce platform. I adapted the very helpful code from the AWS tutorial on the English corpus to find out the trending German words (or 1-grams) for the last century. You need to have an Amazon AWS account and valid SSH keys to connect to the machines you are running the MapReduce programs on (here’s the whole hive query file).

  • Start your Elastic MapReduce cluster on the EMR console. I used 1 Master and 19 slave nodes. Select your AWS ssh authorization key. Remember: from this moment on, your cluster is generating costs. So, don’t forget to terminate the cluster after the job is done!
  • If your Cluster has been set-up and is running, note the Master-Node-DNS. Open a SSH client (e.g. Putty on Windows or ssh on Linux) and connect to the master node with the ssh key. Your username on the remote machine is “hadoop”.
  • Start “hive” and set some useful defaults for the analytical job:

    set hive.base.inputformat=org.apache.hadoop.hive.ql.io.HiveInputFormat;
    set mapred.min.split.size=134217728;

  • The first code snippet connects to the 1-gram dataset which resides on the S3 storage:

    CREATE EXTERNAL TABLE german_1grams (
    gram string,
    year int,
    occurrences bigint,
    pages bigint,
    books bigint
    )
    ROW FORMAT DELIMITED FIELDS TERMINATED BY '\t'
    STORED AS SEQUENCEFILE
    LOCATION 's3://datasets.elasticmapreduce/ngrams/books/20090715/ger-all/1gram/';

  • Now, we can use this database to perform some operations. The first step is to normalize the database, e.g. to transform all words to lower case and remove 1-grams that are no proper words. Of course you could further refine this step to remove stopwords or reduce the words to their stems by stemming or lemmatization.

    CREATE TABLE normalized (
    gram string,
    year int,
    occurrences bigint
    );

    And then we populate this table:

    INSERT OVERWRITE TABLE normalized
    SELECT
    lower(gram),
    year,
    occurrences
    FROM
    german_1grams
    WHERE
    year >= 1889 AND
    gram REGEXP "^[A-Za-z+'-]+$";

  • The previous steps should run quite fast. Here’s the step that really need to be run on a multi-machine cluster:

    CREATE TABLE by_decade (
    gram string,
    decade int,
    ratio double
    );

    INSERT OVERWRITE TABLE by_decade
    SELECT
    a.gram,
    b.decade,
    sum(a.occurrences) / b.total
    FROM
    normalized a
    JOIN (
    SELECT
    substr(year, 0, 3) as decade,
    sum(occurrences) as total
    FROM
    normalized
    GROUP BY
    substr(year, 0, 3)
    ) b
    ON
    substr(a.year, 0, 3) = b.decade
    GROUP BY
    a.gram,
    b.decade,
    b.total;

  • The final step is to count all the trending words and export the data:

    CREATE TABLE result_decade (
    gram string,
    decade int,
    ratio double,
    increase double );

    INSERT OVERWRITE TABLE result_decade
    SELECT
    a.gram as gram,
    a.decade as decade,
    a.ratio as ratio,
    a.ratio / b.ratio as increase
    FROM
    by_decade a
    JOIN
    by_decade b
    ON
    a.gram = b.gram and
    a.decade - 1 = b.decade
    WHERE
    a.ratio > 0.000001 and
    a.decade >= 190
    DISTRIBUTE BY
    decade
    SORT BY
    decade ASC,
    increase DESC;

  • The result is saved as a tab delimited plaintext data file. We just have to find out its correct location and then transfer it from the Hadoop HDFS file system to the “normal” file system on the remote machine and then transfer it to our local computer. The (successful) end of the hive job should look like this on your ssh console:
    EMR_finish
    The line “Deleted hdfs://x.x.x.x:9000/mnt/hive_0110/warehouse/export” gives you the information where the file is located. You can transfer it with the following command:

    $ hdfs dfs -cat /mnt/hive_0110/warehouse/export/* > ~/export_file.txt

  • Now the data is in the home directory of the remote hadoop user in the file export_file.txt. With a secure file copy program such as scp or WinSCP you can download the file to your local machine. On a Linux machine, I should have converted the AWS SSH key in the Linux format (id_rsa and id_rsa.pub) and then added. With the following command I could download our results (replace x.x.x.x with your IP address or the Master-Host-DNS):

    $ scp your_username@x.x.x.x:export_file.txt ~/export_file.txt

  • After you verified that the file is intact, you can terminate your Elastic MapReduce instances.

As a result you get a large text file with information on the ngram, decade, relative frequency and growth ratio in comparison with the previous decade. After converting this file into a more readable Excel document with this Python program, it looks like this:
ngrams_results

Values higher than 1 in the increase column means that this word has grown in importance while values lower than 1 means that this word had been used more frequently in the previous decade.

Here’s the top 30 results per decade:

  • 1900s: Adrenalin, Elektronentheorie, Textabb, Zysten, Weininger, drahtlosen, Mutterschutz, Plazenta, Tonerde, Windhuk, Perseveration, Karzinom, Elektrons, Leukozyten, Housz, Schecks, kber, Zentralwindung, Tarifvertrags, drahtlose, Straftaten, Anopheles, Trypanosomen, radioaktive, Tonschiefer, Achsenzylinder, Heynlin, Bastimento, Fritter, Straftat
  • 1910s: Commerzdeputation, Bootkrieg, Diathermie, Feldgrauen, Sasonow, Wehrbeitrag, Bolschewismus, bolschewistischen, Porck, Kriegswirtschaft, Expressionismus, Bolschewiki, Wirtschaftskrieg, HSM, Strahlentherapie, Kriegsziele, Schizophrenie, Berufsberatung, Balkankrieg, Schizophrenen, Enver, Angestelltenversicherung, Strahlenbehandlung, Orczy, Narodna, EKG, Besenval, Flugzeugen, Flugzeuge, Wirkenseinheit
  • 1920s: Reichsbahngesellschaft, Milld, Dawesplan, Kungtse, Fascismus, Eidetiker, Spannungsfunktion, Paneuropa, Krestinski, Orogen, Tschechoslovakischen, Weltwirtschaftskonferenz, RSFSR, Sachv, Inflationszeit, Komintern, UdSSR, RPF, Reparationszahlungen, Sachlieferungen, Konjunkturforschung, Schizothymen, Betriebswirtschaftslehre, Kriegsschuldfrage, Nachkriegsjahre, Mussorgski, Nachkriegsjahren, Nachkriegszeit, Notgemeinschaft, Erlik
  • 1930s: Reichsarbeitsdienst, Wehrwirtschaft, Anerbengericht, Remilitarisierung, Steuergutscheine, Huguenau, Molotov, Volksfront, Hauptvereinigung, Reichsarbeitsdienstes, Viruses, Mandschukuo, Erzeugungsschlacht, Neutrons, MacHeath, Reichsautobahnen, Ciano, Vierjahresplan, Erbkranken, Schuschnigg, Reichsgruppe, Arbeitsfront, NSDAP, Tarifordnungen, Vierjahresplanes, Mutationsrate, Erbhof, GDI, Hitlerjugend, Gemeinnutz
  • 1940s: KLV, Cibazol, UNRRA, Vollziehungsrath, Bhil, Verordening, Akha, Sulfamides, Ekiken, Wehrmachtbericht, Capsiden, Meau, Lewerenz, Wehrmachtsbericht, juedischen, Kriegsberichter, Rourden, Gauwirtschaftskammer, Kriegseinsatz, Bidault, Sartre, Riepp, Thailands, Oppanol, Jeftanovic, OEEC, Westzonen, Secretaris, pharmaceutiques, Lodsch
  • 1950s: DDZ, Peniteat, ACTH, Bleist, Siebenjahrplan, Reaktoren, Cortison, Stalinallee, Betriebsparteiorganisation, Europaarmee, NPDP, SVN, Genossenschaftsbauern, Grundorganisationen, Sputnik, Wasserstoffwaffen, ADAP, BverfGg, Chruschtschows, Abung, CVP, Atomtod, Chruschtschow, Andagoya, LPG, OECE, LDPD, Hakoah, Cortisone, GrundG
  • 1960s: Goldburg, Dubcek, Entwicklungszusammenarbeit, Industriepreisreform, Thant, Hoggan, Rhetikus, NPD, Globalstrategie, Notstandsgesetze, Nichtverbreitung, Kennedys, PPF, Pompidou, Nichtweiterverbreitung, neokolonialistischen, Teilhards, Notstandsverfassung, Biafra, Kiesingers, McNamara, Hochhuth, BMZ, OAU, Dutschke, Rusk, Neokolonialismus, Atomstreitmacht, Periodikums, MLF
  • 1970s: Zsfassung, Eurokommunismus, Labov, Sprechakttheorie, Werkkreis, Uerden, Textsorte, NPS, Legitimationsprobleme, Aktanten, Kurztitelaufnahme, Parlamentsfragen, Textsorten, Soziolinguistik, Rawls, Uird, Textlinguistik, IPW, Positivismusstreit, Jusos, UTB, Komplexprogramms, Praxisbezug, performativen, Todorov, Namibias, Uenn, ZSta, Energiekrise, Lernzielen
  • 1980s: Gorbatschows, Myanmar, Solidarnosc, FMLN, Schattenwirtschaft, Gorbatschow, Contadora, Sandinisten, Historikerstreit, Reagans, sandinistische, Postmoderne, Perestrojka, BTX, Glasnost, Zeitzeugen, Reagan, Miskito, nicaraguanischen, Madeyski, Frauenforschung, FSLN, sandinistischen, Contras, Lyotard, Fachi, Gentechnologie, UNIX, Tschernobyl, Beijing
  • 1990s: BSTU, Informationsamt, Sapmo, SOEP, Tschetschenien, EGV, BMBF, OSZE, Zaig, Posllach, Oibe, Benchmarking, postkommunistischen, Reengineering, Gauck, Osterweiterung, Belarus, Tatarstan, Beitrittsgebiet, Cyberspace, Goldhagens, Treuhandanstalt, Outsourcing, Modrows, Diensteinheiten, EZB, Einigungsvertrages, Einigungsvertrag, Wessis, Einheitsaufnahme
  • 2000s: MySQL, Servlet, Firefox, LFRS, Dreamweaver, iPod, Blog, Weblogs, VoIP, Weblog, Messmodells, Messmodelle, Blogs, Mozilla, Stylesheet, Nameserver, Google, Markenmanagement, JDBC, IPSEC, Bluetooth, Offshoring, ASPX, WLAN, Wikipedia, Messmodell, Praxistipp, RFID, Grin, Staroffice

Mining Research Interests – or: What Would Google Want to Know?

I am a regular visitor of Google’s research page where they post all of their latest and upcoming scientific papers. Lately I have thought whether it would be possible to statistically extract some of the meta-information from the papers. Here’s the result of the analysis of the papers’ titles produced with just a few lines of R code:

Research Topics @ Google


I clustered the data with a standard hierarchical cluster analysis to find out which terms tend to often go together in the paper titles. Then I took a deeper look at the abstracts – of all the papers that had abstracts that is. I processed the abstracts with the tm R package and draw the following heat-map that shows how often which of the most important keywords appear in each paper:

Keywords_Abstracts_google

I did a similar heatmap but this time normalized by the term frequency – inverse document frequency measure. While the first heatmap shows the most frequently used terms, this weighted heatmap shows terms that are quite important in their respective research papers but normalizes this by the overall term frequency.

Keywords_Abstracts_google_tfidf

If you need input for playing buzzword bingo at the next Strata Conference in Santa Clara, you don’t have to look any further 😉

Social Sensors

“So, what’s the mood of America?”
Interface, 1994

One of the most fascinating novels so far on data-driven politics is Neal Stephenson’s and J. Frederick George’s “Interface“, first published in 1994. Although written almost 20 years ago, many of the technologies discussed in this book, would still be cutting edge if employed right now in 2013. One of the most original political devices is the PIPER wristwatch, a device for watching political content such as debates or candidate’s news coverage, while analyzing the wearers’ emotional reaction to these images in real-time by measuring bodily reactions such as pulse, blood pressure or galvanic skin response. This device is a miniaturized polygraph embedded in a controlled political feedback loop.

Social sensors on Twitter for conversations and trends in modern arts

What’s really interesting about the PIPER project: These sensors are not applied to all Americans or to a sample of them, but to a rather small number of types. Here are some examples from a rather extensive list of the types that are monitored this way (p. 360-1):

  • irrelevant mouth breather
  • 400-pound tab drinker
  • burger-flipping history major
  • bible-slinging porch monkey
  • pretentious urban-lifestyle slave
  • formerly respectable bankruptcy survivor

In the novel, the interface of this technology is described as follows:

By examining those graphs in detail, Ogle could assess the emotional status of any one of the PIPER 100. But they provided more detail than Ogle could really handle during the real-time stress of a major campaign event. So Aaron had come up with a very simple, general color-coding scheme […] Red denoted fear, stress, anger, anxiety. Blue denoted negative emotions centered in higher parts of the brain: disagreement, hostility, a general lack of receptiveness. And green meant that the subject liked what they saw. (p. 372)

This immediately grabbed my attention because this is exactly what we are doing in advanced market research projects at the moment: Segmenting a population (in this case: the US electorate) in different personae that represent a larger and more important relevant part of the population under study. And a similar approach is used in innovation research, where one would also focus on “lead-users” that are ahead of their peers when it comes to the identification and experimentation with trends in their respective subject.

Quite recently, this kind of approach has surfaced in various academic publications on Twitter analysis and prediction under the name of “social sensors” (e.g. Sakaki, Okazaki and Matsuo on Twitter earthquake detection or Uddin, Amin, Le, Abdelzaher, Szymanski and Guyen on the right choice of Twitter sensors). The idea is, not to monitor the whole Twitter firehose or everything that is being posted about some hashtag (this would be the regular Social Media Monitoring approach), but to select a smaller number of Twitter accounts that have a history of delivering fast and reliable information.

Big Data journal launches in 2013

A very clear indicator that a topic is not only an ephemeral hype is when there will be a scientific journal for this new topic. This has just happened with Big Data as Liebert publishers just announced at the Strata conference the launch of their peer-reviewed journal “Big Data” for 2013. It will be edited by O’Reilly’s Edd Dumbill.

But you don’t have to wait until the next year, but can already grab a special preview issue featuring five original articles for download right now.

All peer-reviewed articles will be published under a Creative Commons licence and therefore be available for free when they will be published.