
Data storytelling has become a regular topic at data science conferences, and with good cause. First: The story is what gives meaning to the data, leads to people understanding our analysis, and supports the discussion of our findings, but second: Our interpretation of the data is at least to some extend arbitrary and subjective, and no harm is done to admit that. Compared however to stories without any data support, data-driven narratives have a far better chance to maintain their statement. No wonder, data-driven journalism is on the rise.
In social sciences, we are used to data that are already highly abstract. We ask people, “Can you remember this ad?” Without much questioning the concept behind using what we presume to be words of everyday language. Hence the interpretation is straight forward.
When we use measurements instead of verbal surveys, the situation is much more complicated (but also much more interesting). The data we collect, e.g. from tracking mobile phones, as such doesn’t tell much, at all.
A useful step-by-step way to get meaning into data by gradually abstracting was proposed by Pei et.al.: “Human Behavior Cognition Using Smartphone Sensors“, Sensors 2013, 13, 1402-1424; doi:10.3390/s130201402
My approach is just a simplification of theirs.
 In the first layer, we collect the raw data – which often is a demanding task in its own right.
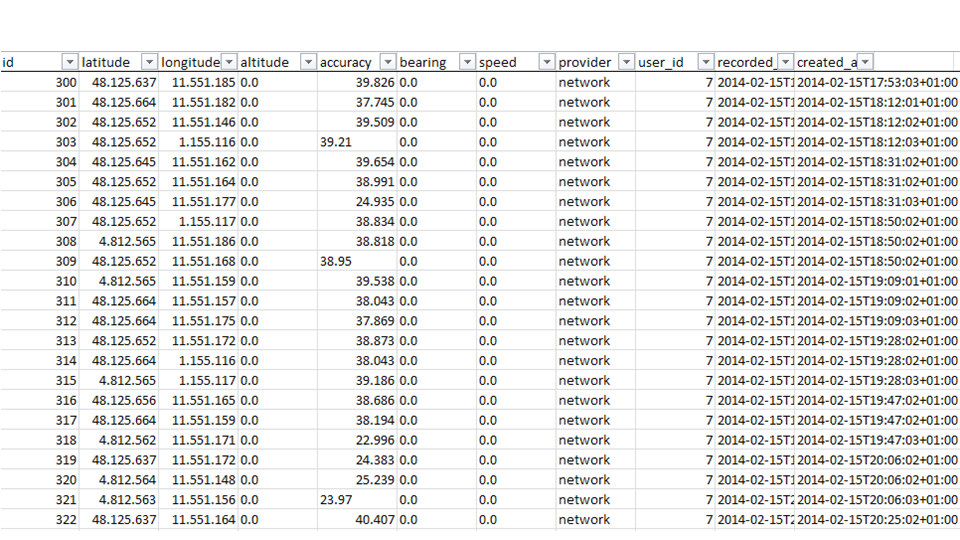
With the data just collected, we still do not see much. We have absolute numbers that are encoded to an arbitrary scale. If e.g. we have distances or speed measurements, the numbers won’t tell us, if metric or imperial scale is applicable. We don’t know of any tolerances either, don’t see the bias in missing values, and so on. So we usually have to enrich the raw readings with meta data. This step is called data munging.
 Now we start abstracting from the raw data.
What somebody understands as the occurrence of certain event is also at least partly subjective. I might count some movement of mine as a step while someone else might already call it a leap. What we need to understand the events, is context.
 I the third layer, we derive simple context, e.g. by adding location data, or other environmental information like temperature.
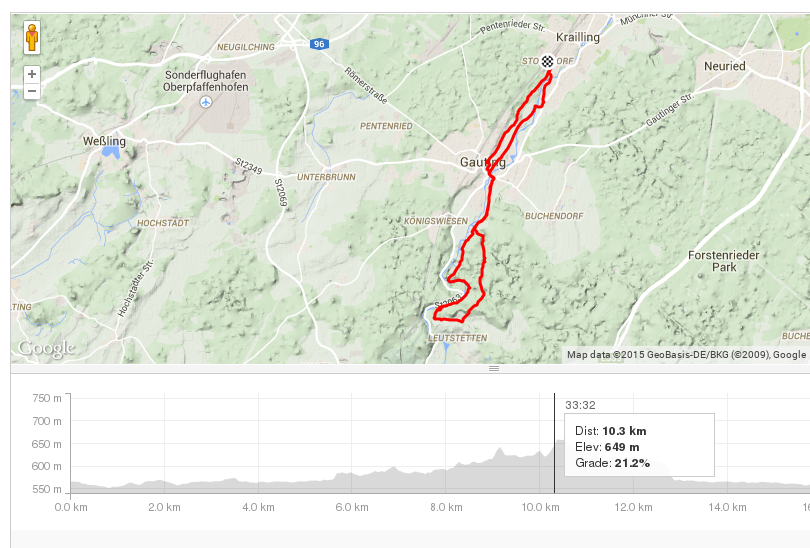
 The fourth layer is finally the rich context. What did really happen? The rich context is hardly ever to be drawn just from our data. Historic, cultural, or medical conditions add to that. We won’t tell a plausible story, if we don’t embed it in the panorama that our audience would expect us to experience, if they would have lived through the story in person. For rich context, we regularly need people’s opinions and personal situation. This is when data science finally gets married to classic social research: The questionnaire based interview – just ask people what they experienced while we measured what happened.
Data science lays the grounding for our pyramid, with social science at its pinnacle.