Monday, I’ll be speaking on “Linked Data” at the 49th German Market Research Congress 2014. In my talk, there will be many examples of how to apply the basic approach and measurements of Social Network Analysis to various topics ranging from brand affinities as measured in the market-media study best for planning, the financial network between venture capital firms and start-ups and the location graph on Foursquare.
Because I haven’t seen many examples on using the Foursquare API to generate location graphs, I would like to explain my approach a little bit deeper. At first sight, the Foursquare API differs from many other Social Media APIs because it just allows you to access data about your own account. So, there is no general stream (or firehose) of check-in events that could be used to calculate user journeys or the relations between different places.
Fortunately, there’s another method that is very helpful for this purpose: You can query the API for any given Foursquare location to output up to five venues that were most frequently accessed after this location. This begs for a recursive approach of downloading the next locations for the next locations for the next locations and so on … and transform this data into the location graph.
I’ve written down this approach in an IPython Notebook, so you just have to find your API credentials and then you can start downloading your cities’ location graph. For Munich it looks like this (click to zoom):
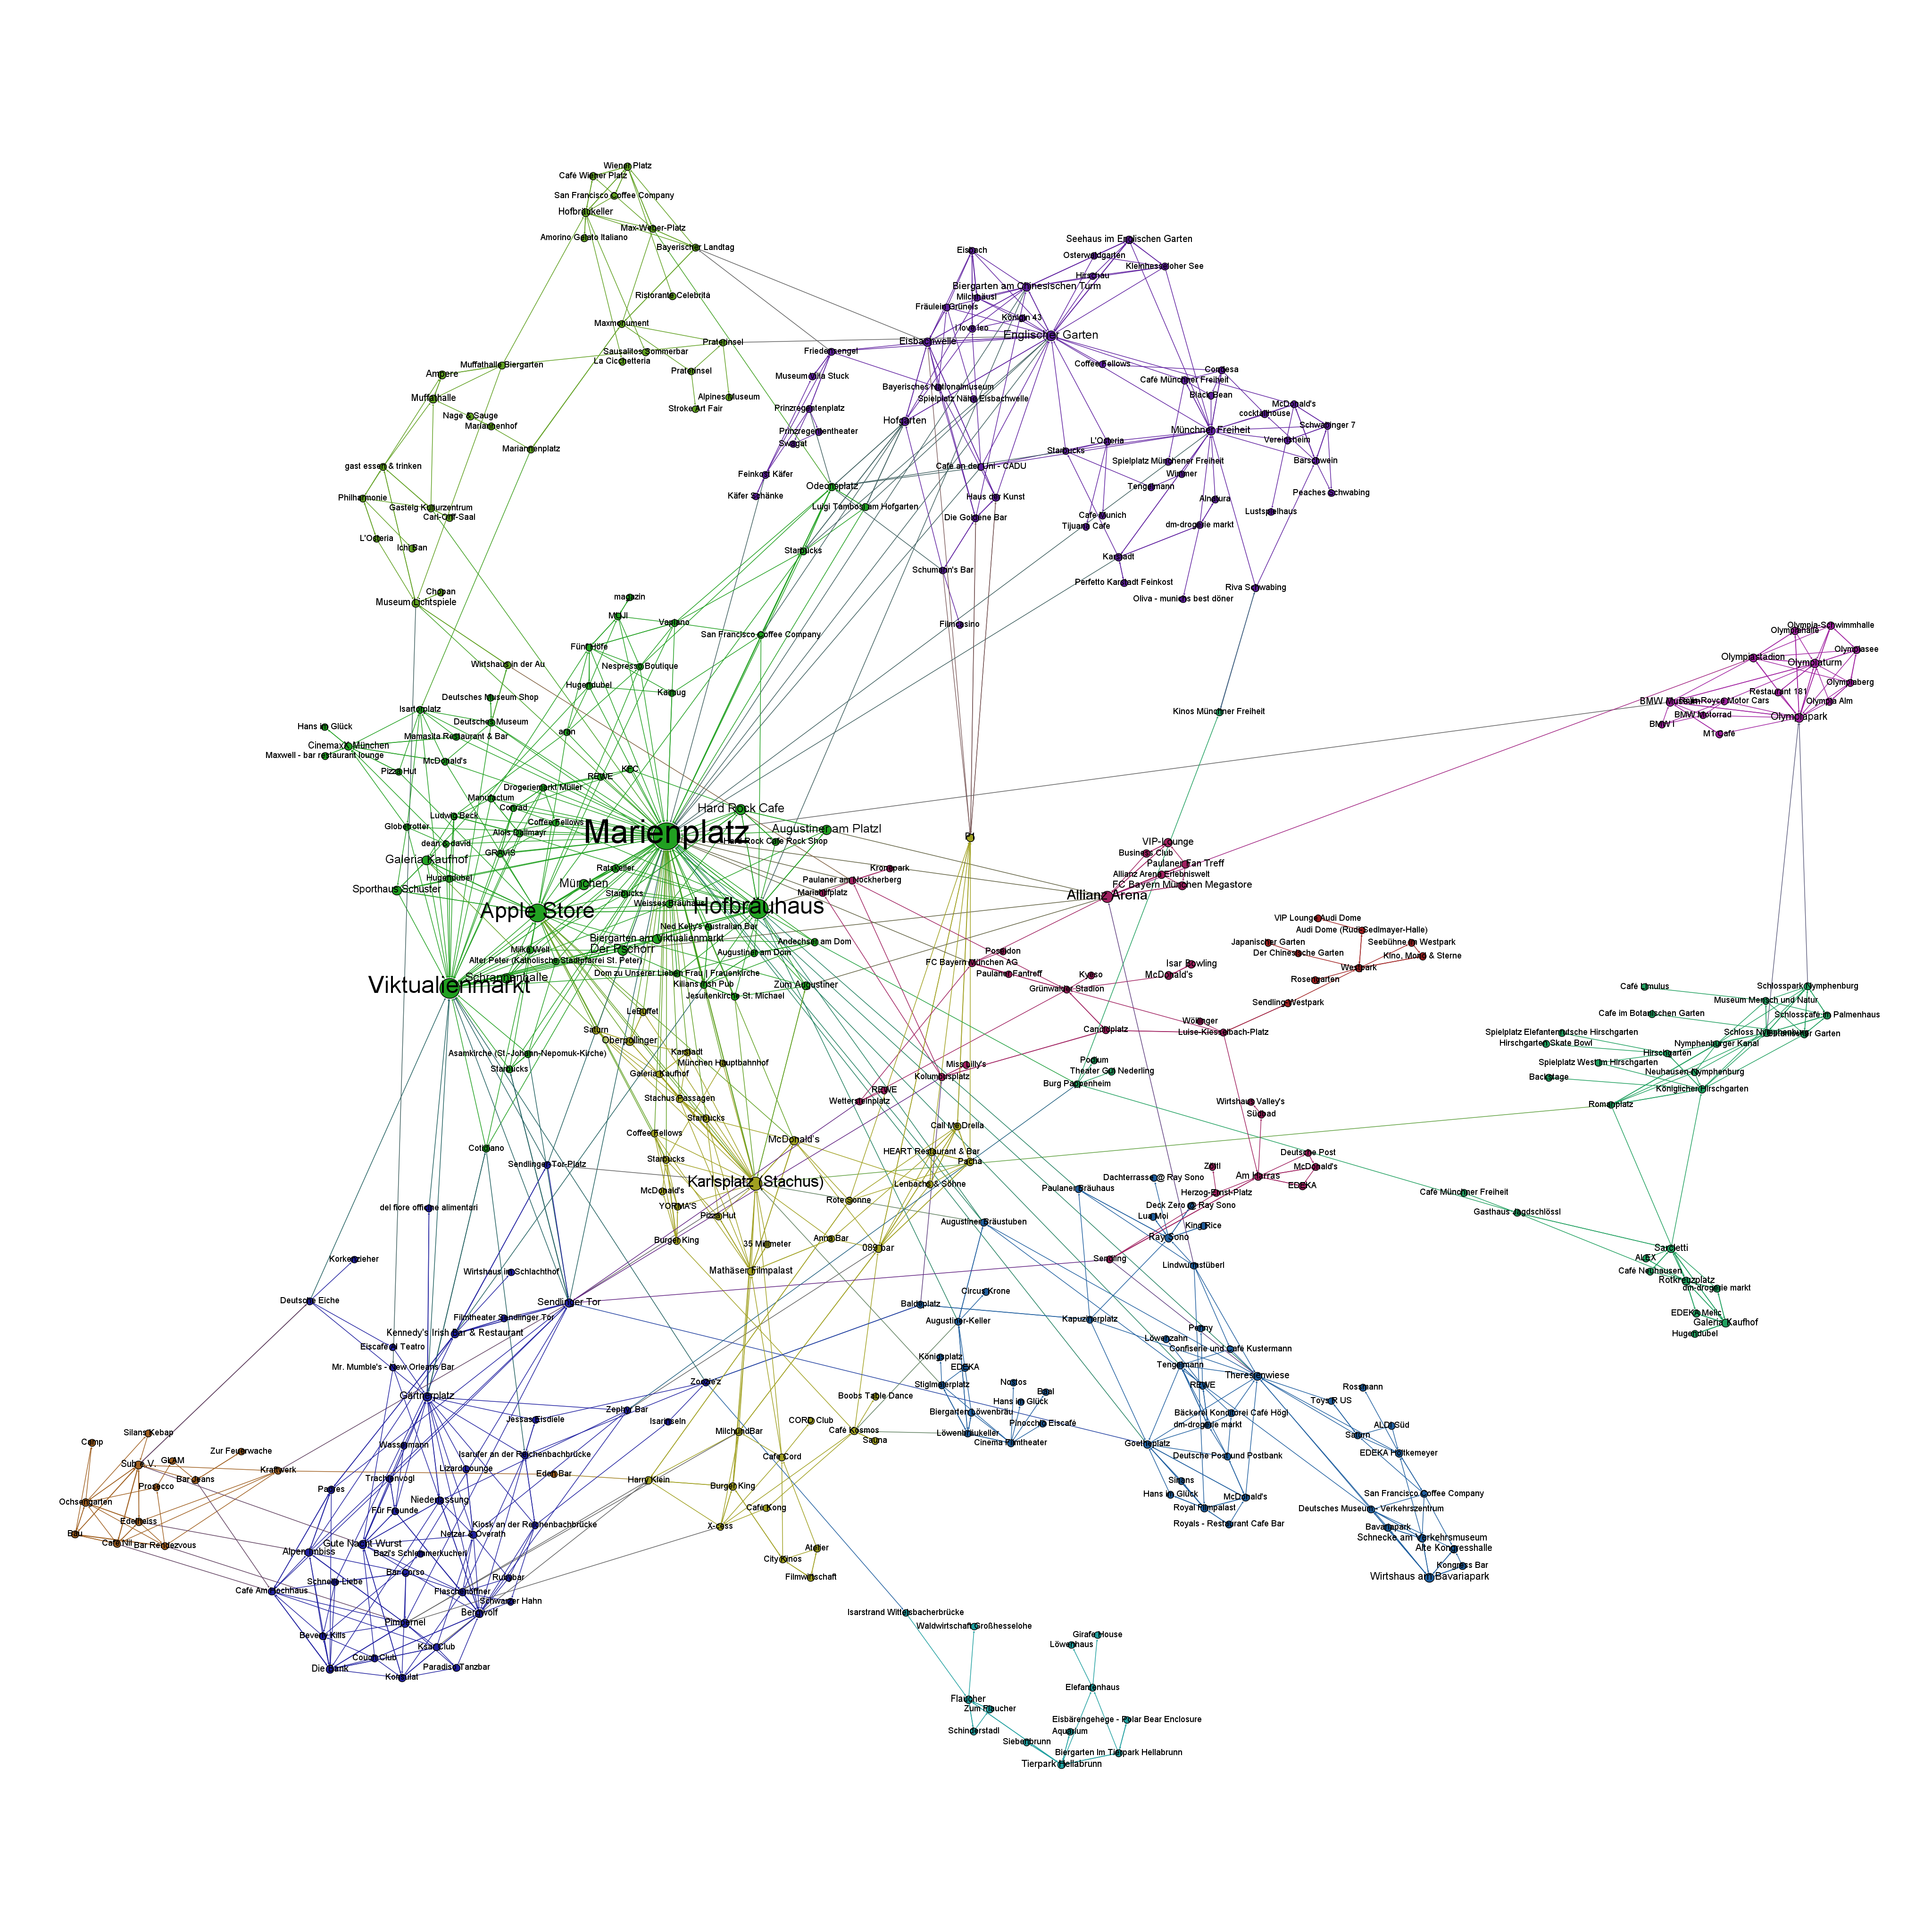
The resulting network is very interesting, because the “distance” between the different locations is a fascinating mixture of
- spatial distance: places that are nearby are more likely to be connected (think of neighborhoods)
- temporal distance: places that can be reached in a short time are more likely to be connected (think of places that are quite far apart but can be reached in no time by highway)
- affective/social distance: places that belong to a common lifestyle are more likely to be connected
Feel free to clone the code from my github. I’m looking forward to seeing the network visualizations of your cities.