One of the most remarkable features of this year’s Strataconf was the almost universal use of IPython notebooks in presentations and tutorials. This framework not only allows the speakers to demonstrate each step in the data science approach but also gives the audience an opportunity to do the same – either during the session or afterwards.
Here’s a list of my favorite IPython notebooks on machine learning and data science. You can always find a lot more on this webpage. Furthermore, there’s also the great notebookviewer platform that can render Github’bed notebooks as they would appear in your browser. All the following notebooks can be downloaded or cloned from the GitHub page to work on your own computer or you can view (but not edit) them with nbviewer.
So, if you want to learn about predictions, modeling and large-scale data analysis, the following resources should give you a fantastic deep dive into these topics:
1) Mining the Social Web by Matthew A. Russell
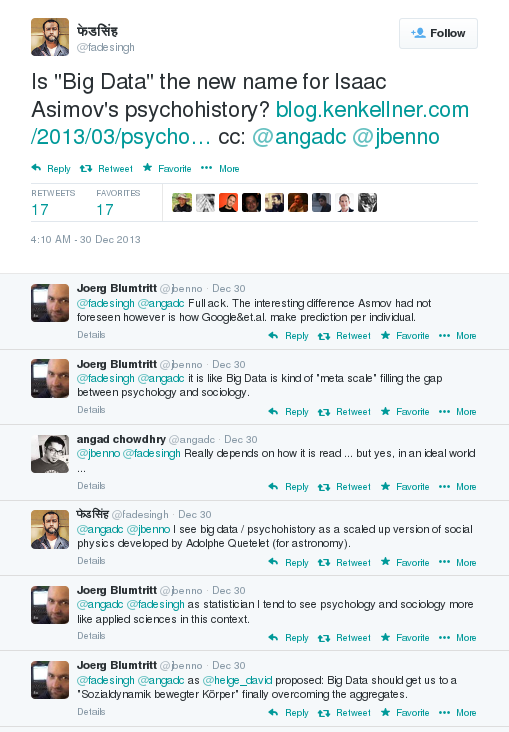
 If you want to learn how to automatically extract information from Twitter streams, Facebook fanpages, Google+ posts, Github accounts and many more information sources, this is the best resource to start. It started out as the code repository for Matthew’s O’Reilly published book, but since the 2nd edition has become an active learning community. The code comes with a complete setup for a virtual machine (Vagrant based) which saves you a lot of configuring and version-checking Python packages. Highly recommended!
2) Probabilistic Programming and Bayesian Methods for Hackers by Cameron Davidson-Pilon
 This is another heavy weight among my IPython notebook repositories. Here, Cameron teaches you Bayesian data analysis from your first calculation of posteriors to a real-time analysis of GitHub repositories forks. Probabilistic programming is one of the hottest topics in the data science community right now – Beau Cronin gave a mind-blowing talk at this year’s Strata Conference (here’s the speaker deck) – so if you want to join the Bayesian gang and learn probabilistic programming systems such as PyMC, this is your notebook.
3) Parallel Machine Learning Tutorial by Olivier Grisel
 The tutorial session on parallel machine learning and the Python package scikit-learn by Olivier Grisel was one of my highlights at Strata 2014. In this notebook, Olivier explains how to set up and tune machine learning projects such as predictive modeling with the famous Titanic data-set on Kaggle. Modeling has far too long been a secret science – some kind of Statistical Alchemy, see the talk I gave at Siemens on this topic – and the time has come to democratize the methods and approaches that are behind many modern technologies from behavioral targeting to movie recommendations. After the introduction, Olivier also explains how to use parallel processing for machine learning projects on really large data-sets.
4) 538 Election Forecasting Model by Skipper Seabold
 Ever wondered how Nate Silver calculated his 2012 presidential election forecasts? Don’t look any further. This notebook is reverse engineering Nate’s approach as he described it on his blog and in various interviews. The notebook comes with the actual polling data, so you can “do the Nate Silver” on your own laptop. I am currently working on transforming this model to work with German elections – so if you have any ideas on how to improve or complete the approach, I’d love to hear from you in the comments section.
5) Six Degrees of Kevin Bacon by Brian Kent
 This notebook is one of the showcases for the new GraphLab Python package demonstrated at Strata Conference 2014. The GraphLab library allows very fast access to large data structures with a special data frame format called the SFrame. This notebook works on the Freebase movie database to find out whether the Kevin Bacon number really holds true or whether there are other actors that are more central in the movie universe. The GraphLab package is currently in public beta.
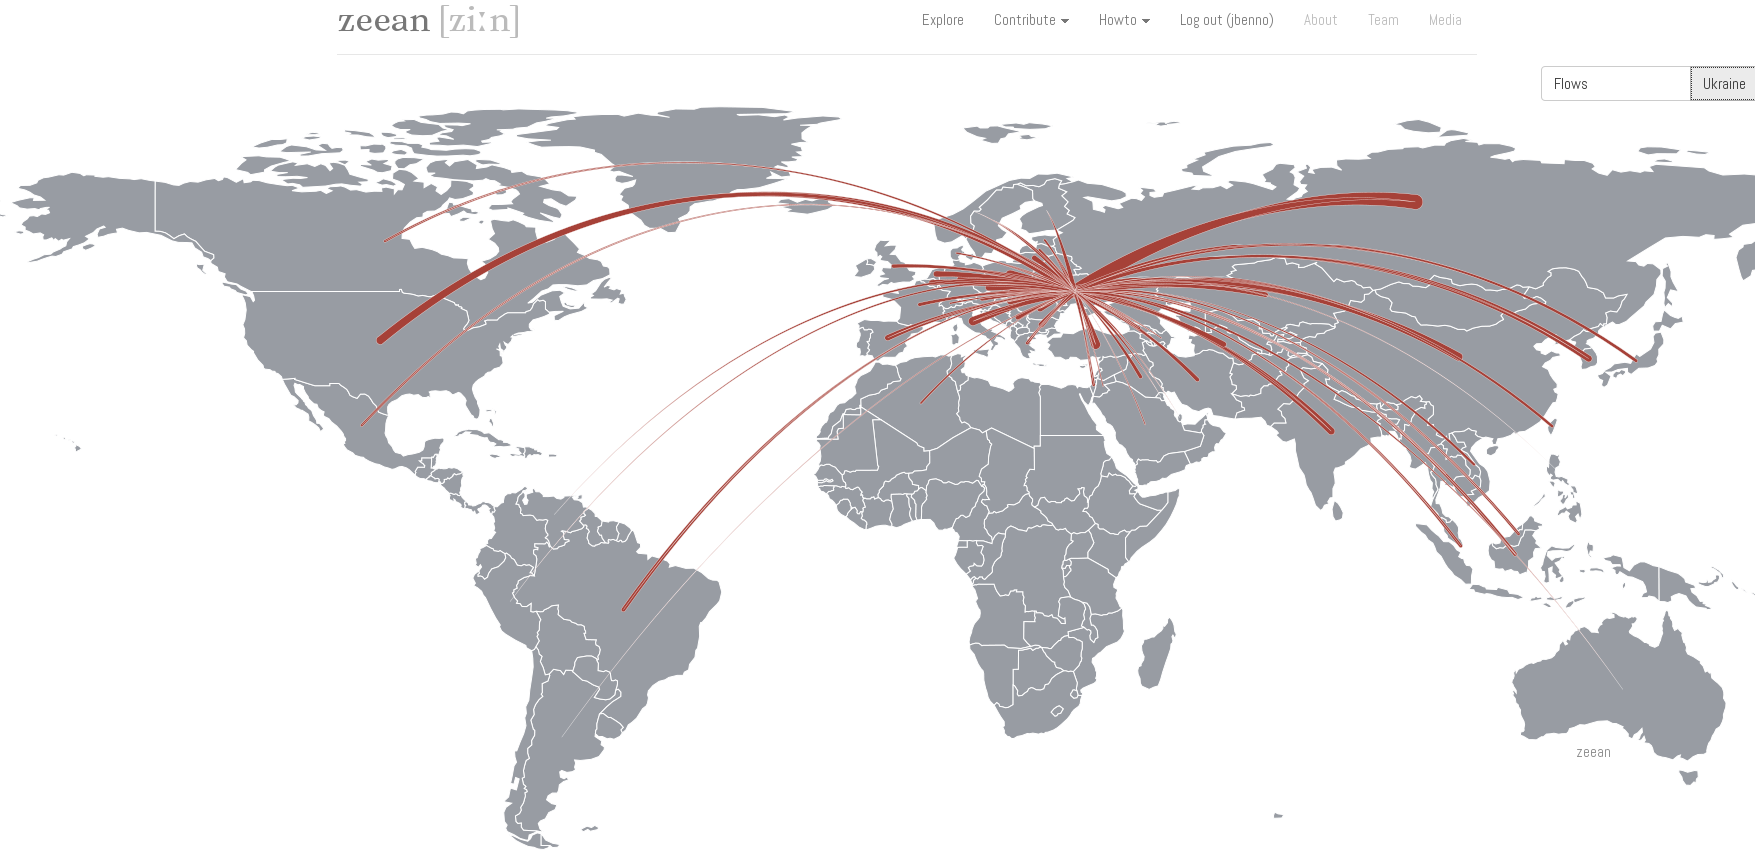
6) Get Close to Your Data with Python and JavaScript by Brian Granger
 The days of holecount and 1000+ pages of statistical tables are finally history. Today, data science and data visualization go together like Bayesian priors and posteriors. One of the hippest and most powerful technologies in modern browser-based visualization is the d3.js framework. If you want to learn about the current state-of-the-art in combining the beauty of d3.js with the ease and convenience of IPython, Brian’s Strata talk is the perfect introduction to this topic.
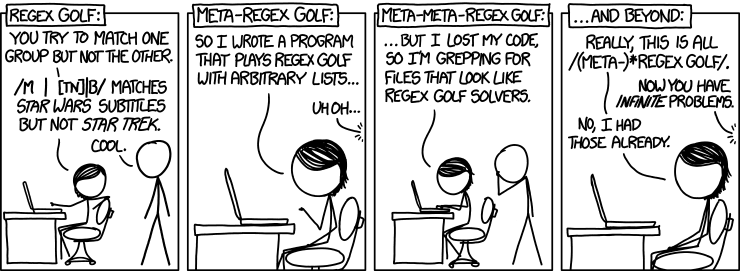 I found the final notebook through the above mentioned talk. Peter Norvig is not only the master mind behind the Google economy, teacher of a wonderful introduction to Python programming at Udacity and author of many scientific papers on applied statistics and modeling, but he also seems to be the true nerd. Who else would take a xkcd comic strip by the word and work out the regular expression matching patterns that provide a solution to the problem posed in the comic strip. I promise that your life will never be the same after you went through this notebook – you’ll start to see programming problems in almost every Internet meme from now on. Let me know, when you found some interesting solutions!