The Quantified Self

The most common words in the Tweets tagged #qseu13 posted over the weekend.
The most common words in the Tweets tagged #qseu13 posted over the weekend. Here you find another visualization: [Wordcloud]
Last weekend the 4th Conference on Quantified Self took place in Amsterdam. Quantified Self is a movement or direction of thought that summarizes many aspects of datarization of the live of people by themselves. The term “QS” was coined by Kevin Kelly and Gary Wolf, who hosted the conference. Thus it cannot be denied that some roots of QS lie in the Bay-Area techno-optimistic libertarianism best represented by Wired. However a second root stems from people who started quantifying themselves to better deal with manifest health problems – be it polar disorder, insomnia or even Parkinson and cancer. In both aspects the own self acts as object and subject to first analyze and then shape itself. Both have to do with self-empowerment and acting on our human condition.

“For Quantified Self, ‘big data’ is more ‘near data’, data that surrounds us.”
Gary Wolf

Quantified Self can be viewed as taking action to reclaim the collection of personal data, not because of privacy but because of curiosity. Why not take the same approach that made Google, Amazon and the like so successful and use big data on yourself?

Tweets per hour during the conference weekend. Of course our physical life finds its expression in data ....
Tweets per hour during the conference weekend. Of course our physical life finds its expression in data ….
Since many QS-people use off-the-shelf gadgets, it is not only important to get full access to the data collected but also transparency on the algorithms that are implemented within. Like Gary Wolf pointed out, if two step-counters vary in their results, it tells us one thing: there is no common concept of ‘What is a step?’. These questions of algorithm ethics become more pressing as our daily life becomes more and more dependent on algorithms but we would usually not have a chance to see into that “black box” and the implicit value judgements that are programmed into it. (I just gave a talk on that specific topic at re:publica last Monday which I will post here later). I think that in no field the problems of algorithms taking ethic decisions becomes more obvious than when data deals immediately with yourself.

What self is there to be quantified?

What is the “me”? What is left, when we deconstruct what we are used to regard as “our self” into quanta? Is there a ghost in the shell? The idea of self-quantification implies an objective self that can be measured. With QS, the rather abstract outcomes of neuroscience or human genetics become tangible. The more we have quantitatively deconstructed us, the less is left for mind/body-dualism.

On est obligé d’ailleurs de confesser que la Perception et ce qui en dépend, est inexplicable par des raisons mécaniques.
G. W. Leibniz

As a Catholic, I was never fond that our Conscious Mind would just be a Mechanical Turk. As a mathematician, I feel deep satisfaction in seeing our world including my very own self becoming datarizable – Pythagoras was right, after all! This dialectic deconstruction of suspicious dualism and materialistic reductionism was discussed in three sessions I attended – Whitney Boesel’s “The missing trackers”, Sarah Watson’s “The self in data” and Natasha Schüll’s “Algorithmic Selfhood”.

“Quantifying yourself is like art: constructing a kind of expression.”
Robin Barooah

Many projects I saw at #qseu13 can be classified as art projects in their effort to find the right language to express the usually unexpresseble. But compared to most “classic” artists I know, the QS-apologetes are far less self-centered (sounds more contradictory than it is) and much more directed to in changing things by using data to find the sweetspot to set their levers.

What starts with counting your steps ends consequently in shaping yourself with technological means. Enhancing your bodily life with technology is the definition of becoming a Cyborg, as my friend Enno Park points out. Enno got Cochlea-implants to overcome his deafness. He now advocates for Cyborg rights – starting with his right to hack into his implants. Enno demands his right to tweak the technology that became part of his head.

Self-hacking will become as common as taking Aspirin to cure a headache. Even more: we will have to get literate in the quantification techniques to keep up with others that would anyway do it for us: biometric security systems, medical imaging and auto-diagnosis. To express ourselves with our data will become part of our communication culture as Social Media have today. So there will be not much of an alternative left for those who have doubts about quantifying themself. “The cost of abstention will drive people to QS.” as Whitney Boesel mentioned.
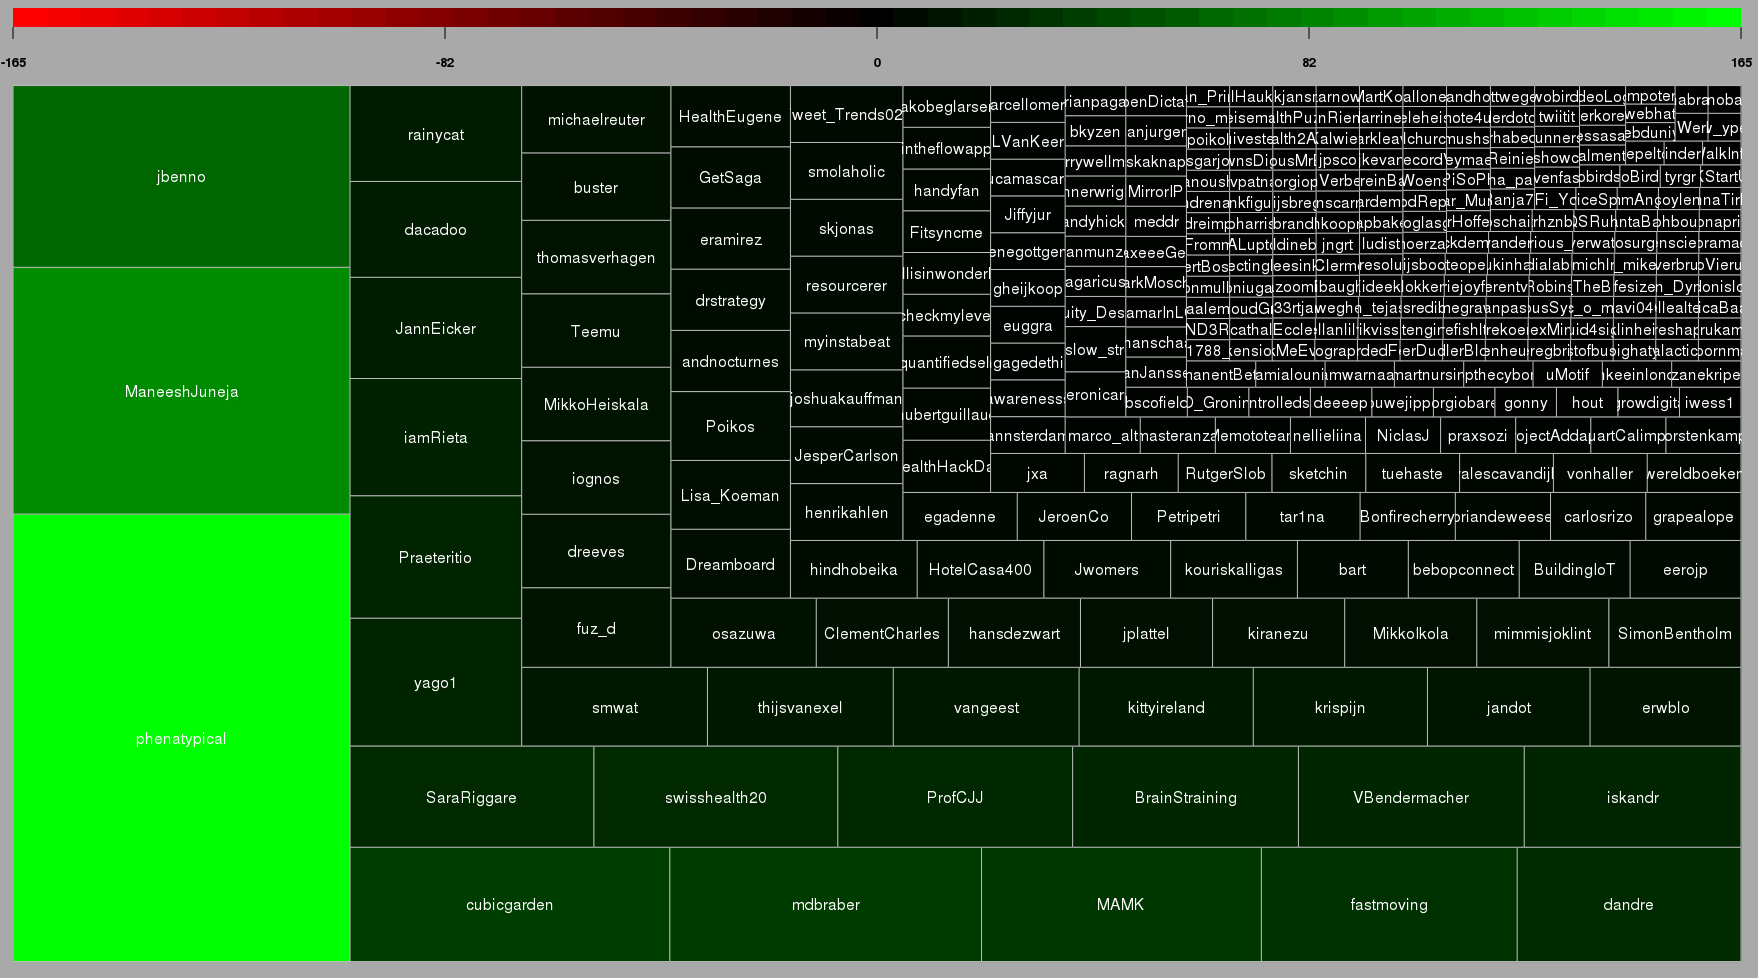
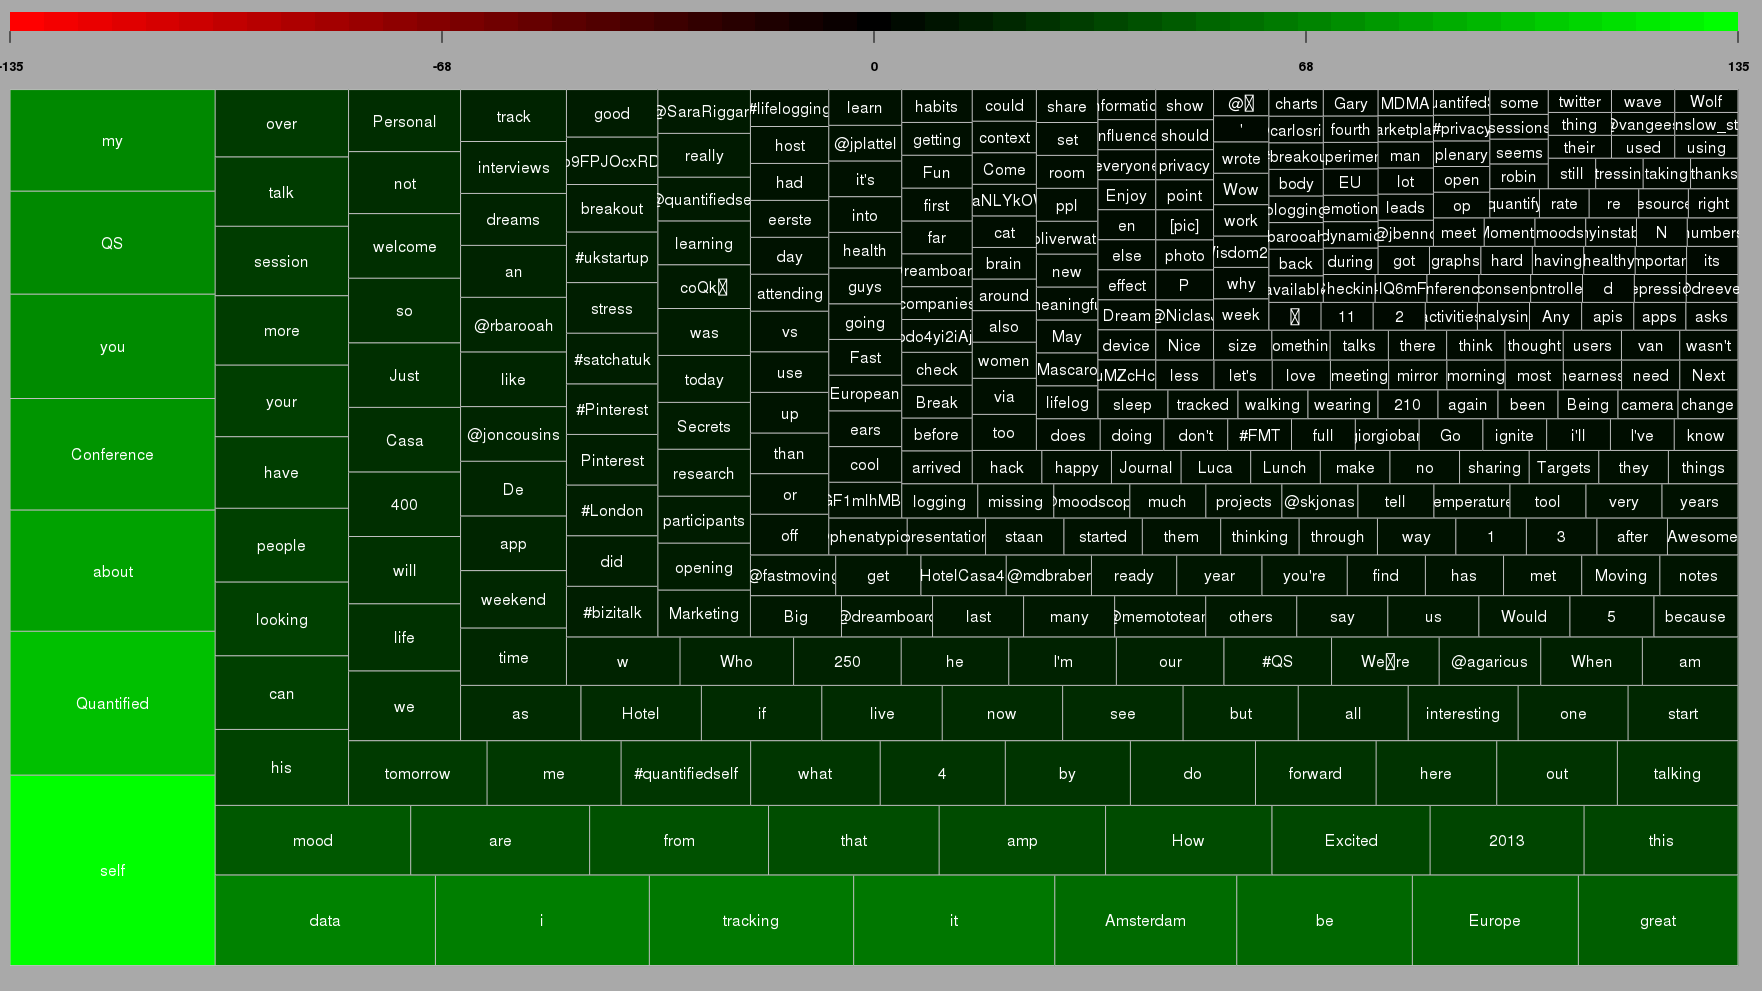
Top Twitterers for #qseu13-conference: 1) Whitney Erin Boesel, 2) Maneesh Juneja 3) that's me ;)
Top Twitterers for #qseu13-conference: 1) Whitney Erin Boesel, 2) Maneesh Juneja 3) that’s me 😉

Why is there something like the Hype Cycle?

In computer science we have learned that we can do with non-linear models only in very unlikely examples. Not only our machines – also our minds are not capable to foresee non-linear developments. One of the achievements of Mandelbrot’s works and the ‘Chaos Theory’ is that we now better understand how this works and that we truly have no alternative.

You might have wondered, why the phenomenon of the Hype has such a distinct form, that consultancies like Gartner can even draw a curve – the famous “Garnter Hype Cycle of Emerging Technologies“. We will try to give a simple explanation.

Fig. 1: the development from inventing a new technology to reaching the market potential can take more or less time.
If a new technology or business model is invented, it is often possible to estimate the market potential in the long run. There are futurists that come up with the social and behavioural changes the new technology will entail and analysts that calculate the economical consequences. And now enter the scenarios. The analysts will estimate the range of time in which the expected development would take place – a “best case” with no resistance and a “worst case” with high persistence of the existing markets (Fig. 1)

Even if we don’t really believe the “best case”, it is wise to prepare for the changes, a “better case” would deliver. We start observing the market figures. We see that the new technology is quickly adopted by our peers (or those how we would love to be peer with …). We see that the new technology gets funding, a valuation that reflects the expected market potential but is effective today.

In reality, it is not that simple to produce and distribute novel technologies or services to mass markets. This requires more skills than just inventing it. There is usually some economy of scale in production and logistics, time to build business relationships and negotiate sales contracts.

Fig. 2: We want to be on the safe side, thus we take the "best case" scenario (and at the same time we experience that the market potential of the new technology is truly there).
Fig. 2: We want to be on the safe side, thus we take the “best case” scenario (and at the same time we experience that the market potential of the new technology is truly there).
So we always tend to overestimate the short term effect. And after we recognise that the thing was over hyped, we feel disappointed and the expectations are adjusted accordingly – the “valley of tears” through almost every start-up has to go. (Fig. 2)

Fig. 3: all linear projections overestimate the short term effect and underestimate the longterm effect.
But this adjusting of our expectations bears more risk than the over hypeing: by projecting the slower growth up to limit of our expected the market potential, we completely underestimate the long-run effect, as you can see in the “belly” that is caught between the sections of the blue arrow and the red curve in Fig. 3.

Why do we find this sigmoid shape of the growth curve? First: the “hype” does normally not happen in the sales numbers of our technology; the “early adopters” are just too few to make a real impact. And after having said this: it is the law of decreasing marginal costs – every new piece is produced (or resp. sold) easier than the lots we had produced before. Just very shortly before hitting the ceiling of the market potential, we see a saturation – diminishing marginal profits when we “reach the plateau”.

We have experienced this with many industries during the last decades: the newspaper publishers – very early experimenting with the new, digital distribution but then completely failing to be ready when time was due; same with the phone makers (we will come to this example later), and we will see this happen again: electric cars, head-up displays, 3d-printing, market research, just to name a few. The astonishing fact is that all these disruptions have already taken place. It is just the linear projections and bad scenario planning that prevents us from taking the right decisions to cope with them.

Foresight: Scenarios vs. Strategies

Chess is a game that does not depend from chance. Every move can be exactly valuated mathematically, and in theory we can calculate the optimal strategy for both colors from any arbitrary position up to the end of the match.

Interestingly there is hardly any “intelligent” chess program. Almost everything that was coded during the last 40 years, solves the match with brute force: just calculating the results for almost every path for a few steps in advance and then choosing a move that is optimal in short term. This works, because the computer can crunch millions of variations after every move. However this can hardly be called strategic.

Regarding foresight in economy, culture, society, etc., we are used to scenarios: we play through all possible developments by changing on parameter at a time. Most prominent is the “Worst Case Scenario”, where we just put all controls of our model to the minimum.

Like in chess, we defeat apparently the most complex problems with this mindless computation. What we will never get are insights on disruptions, epochal changes, revolutions.

Disruptions occur at those points where the curve bends. Mathematically speaking, “bend” means, that the function that describes the development has no derivative at this point, thus it changes its direction spontaneously. If we imagine a car driving along the so far smooth curve, the driver will be caught in complete surprise by the bend in the track.

In reality, these bends almost never happen without some augury. Disruptions evolve by the transposition of processes. We might think of the processes as oscillations, like waves. Not every new wave that adds its influence to the development we have in focus, will cause a noticeable distortion. Many such processes tune into the main waves of the development unrecognized.

Critical are those distortions, new processes, that occur and start to build up with the existing development, like a feedback loop, to finally dominate the development completely.

The art of foresight is to identify exactly these waves that have the potential to build up and break through the system.

We will discuss some examples of this occasionally.