What to expect from Strata Conference 2015? An empirical outlook.

In one week, the 2015 edition of Strata Conference (or rather: Strata + Hadoop World) will open its doors to data scientists and big data practitioners from all over the world. What will be the most important big data technology trends for this year? As last year, I ran an analysis on the Strata abstract for 2015 and compared them to the previous years.

One thing immediately strikes: 2015 will be probably known as the “Spark Strata”:

strata_2015_technologies

If you compare mentions of the major programming languages in data science, there’s another interesting find: R seems to have a comeback and Python may be losing some of its momentum:

strata_2015_languages

R is also among the rising topics if you look at the word frequencies for 2015 and 2014:

strata_2015_words

Now, let’s take a look at bigrams that have been gaining a lot of traction since the last Strata conference. From the following table, we could expect a lot more case studies than in the previous years:

strata_2015_ngrams

This analysis has been done with IPython and Pandas. See the approach in this notebook.

Looking forward to meeting you all at Strata Conference next week! I’ll be around all three days and always in for a chat on data science.

Coolhunting like a Streetfighter

bk_pydata
One of the most exciting applications of Social Media data is the automated identification, evaluation and prediction of trends. I already sketched some ideas in this blog post. Last year – and this was one of my personal highlights – I had the opportunity to speak at the PyData 2014 Berlin on the topic of Street Fighting Trend Research.

In my talk I presented some more general thoughts on trend research (or “coolhunting” as it is called nowadays) on the Internet. But at the core were three examples on how to identify research trends from the web (see this blogpost), how to mine conference proposals (see this analysis of Strata abstracts) and how to identify trending locations on Foursquare (see here). All three examples are also available as IPython Notebooks on my Github page. And here’s the recorded version of the talk.

The PyData conference was one of the best conferences I attended. Not only were the topics very diverse – ranging from GPU optimization to the representation of women in the PyData community – but also the people attending the conference were coming from different backgrounds: lawyers, engineers, physicists, computer scientists (of course) or statisticians. But still, with every talk and every conversation in the hallways, you could feel the wild euphoria connecting us all with the programming language and the incredible curiosity.

The Top 7 Beautiful Data Blog Posts in 2014

Domo_After2014 was a great year in data science – and also an exciting year for me personally from a very inspirational Strata Conference in Santa Clara to a wonderful experience of speaking at PyData Berlin to founding the data visualization company DataLion. But it also was a great year blogging about data science. Here’s the Beautiful Data blog posts our readers seemed to like the most:

  1. Datalicious Notebookmania – My personal list of the 7 IPython notebooks I like the most. Some of them are great for novices, some can even be challenging for advanced statisticians and datascientists
  2. Trending Topics at Strata Conferences 2011-2014 – An analysis of the topics most frequently mentioned in Strata Conference abstracts that clearly shows the rising importance of Python, IPython and Pandas.
  3. Big Data Investment Map 2014 – I’ve been tracking and analysing the developments in Big Data investments and IPOs for quite a long time. This was the 2014 update of the network mapping the investments of VCs in Big Data companies.
  4. Analyzing VC investment strategies with Crunchbase data – This blog post explains the code used to create the network.
  5. How to create a location graph from the Foursquare API – In this post, I explain a way to make sense out of the Foursquare API and to create geospatial network visualizations from the data showing how locations in a city are connected via Foursquare checkins.
  6. Text-Mining the DLD Conference 2014 – A very similar approach as I used for the Strata conference has been applied to the Twitter corpus refering to Hubert Burda Media DLD conference showing the trending topics in tech and media.
  7. Identifying trends in the German Google n-grams corpus – This tutorial shows how to analyze Big data-sets such as the Google Book ngram corpus with Hive on the Amazon Cloud.

Text-Mining the DLD Conference 2014

Once a year, the cosmopolitan digital avantgarde gathers in Munich to listen to keynotes on topics all the way from underground gardening to digital publishing at the DLD, hosted by Hubert Burda. In the last years, I did look at the event from a network analytical perspective. This year, I am analyzing the content, people were posting on Twitter in order to make comparisons to last years’ events and the most important trends right now.

To do this in the spirit of Street Fighting Trend Research, I limited myself to openly available free tools to do the analysis. The data-gathering part was done in the Google Drive platform with the help of Martin Hawksey’s wonderful TAGS script that is collecting all the tweets (or almost all) to a chosen hashtag or keyword such as “#DLD14” or “#DLD” in this case. Of course, there can be minor outages in the access to the search API, that appear as zero lines in the data – but that’s not different to data-collection e.g. in nanophysics and could be reframed as adding an extra challenge to the work of the data scientist 😉 The resulting timeline of Tweets during the 3 DLD days from Sunday to Tuesday looks like this:

Twitter Buzz for #DLD14

You can clearly see three spikes for the conference days, the Monday spike being a bit higher than the first. Also, there is a slight decline during lunch time – so there doesn’t seem to be a lot food tweeting at the conference. To produce this chart (in IPython Notebook) I transformed the Twitter data to TimeSeries objects and carefully de-duplicated the data. In the next step, I time shifted the 2013 data to find out how the buzz levels differed between last years’ and this years’ event (unfortunately, I only have data for the first two days of DLD 2013.

DLD14_Buzz_Comp_Comparison

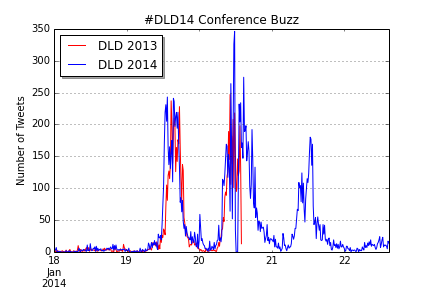
The similarity of the two curves is fascinating, isn’t it? Although there still are minor differences: DLD14 began somewhat earlier, had a small spike at midnight (the blogger meeting perhaps) and the second day was somewhat busier than at DLD13. But still, not only the relative, but also the absolute numbers were almost identical.

Now, let’s take a look at the devices used for sending Tweets from the event. Especially interesting is the relation between this years’ and last years’ percentages to see which devices are trending right now:

DLD14_Clients

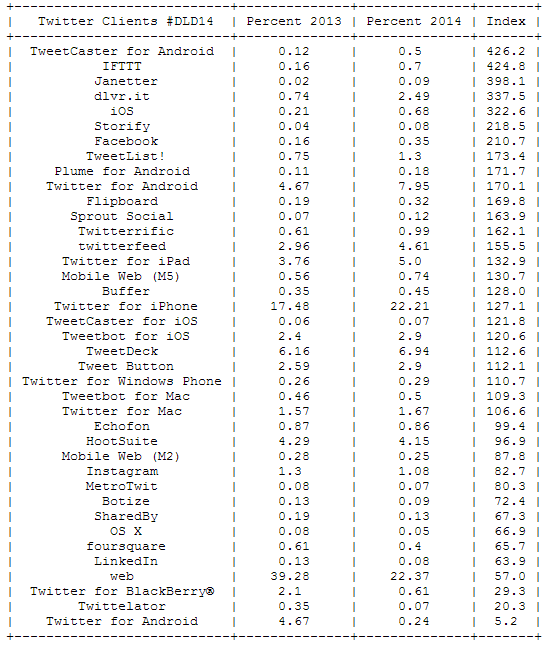
The message is clear: mobile clients are on the rise. Twitter for Android has almost doubled its share between 2013 and 2014, but Twitter for iPad and iPhone have also gained a lot of traction. The biggest losers is the regular Twitter web site dropping from 39 per cent of all Tweets to only 22 per cent.

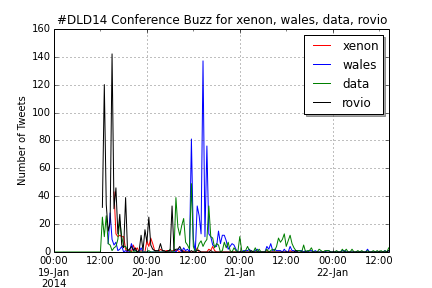
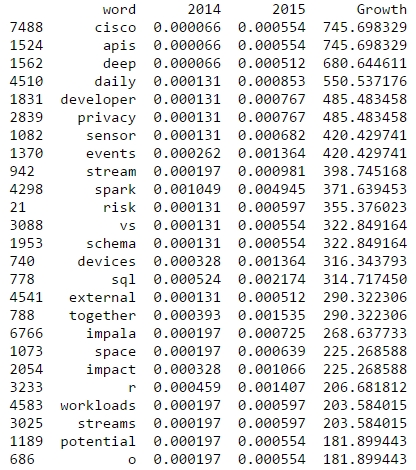
The most important trending word is “DLD14”, but this is not surprising. But the other trending words allow deeper insights into the discussions at the DLD: This event was about a lot of money (Jimmy Wales billion dollar donation), Google, Munich and of course the mobile internet:

DLD14_Words

Compare this with the top words for DLD 2013:

DLD13_Words

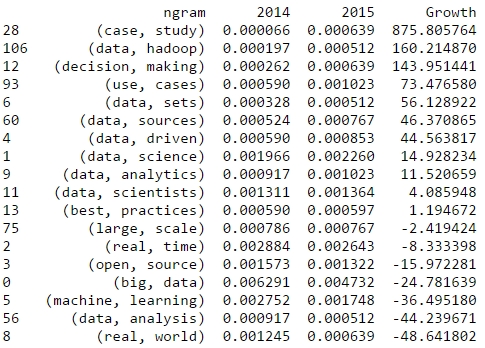
Wait – “sex” among the 25 most important words at this conference? To find out what’s behind this story, I analyzed the most frequently used bigrams or word combinations in 2013 and 2014:

DLD13_Bigrams DLD14_Bigrams

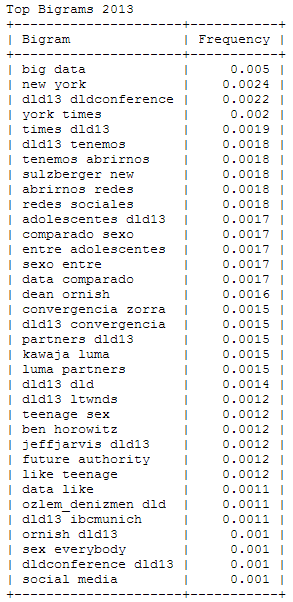
With a little background knowledge, it clearly shows that 2013’s “sex” is originating from a DJ Patil quote comparing “Big Data” (the no. 1 bigram) with “Teenage Sex”. You can also find this quotation appearing in Spanish fragments. Other bigrams that were defining the 2013 DLD were New York (Times) and (Arthur) Sulzberger, while in 2014 the buzz focused on Jimmy Wales, Rovio and the new Xenon processor and its implications for Moore’s law. In both years, a significant number of Tweets are written in Spanish language.

DLD14_Buzzwords_Comp

UPDATE: Here’s the  IPython Notebook with all the code, this analysis has been based on.