What to expect from Strata Conference 2015? An empirical outlook.

In one week, the 2015 edition of Strata Conference (or rather: Strata + Hadoop World) will open its doors to data scientists and big data practitioners from all over the world. What will be the most important big data technology trends for this year? As last year, I ran an analysis on the Strata abstract for 2015 and compared them to the previous years.

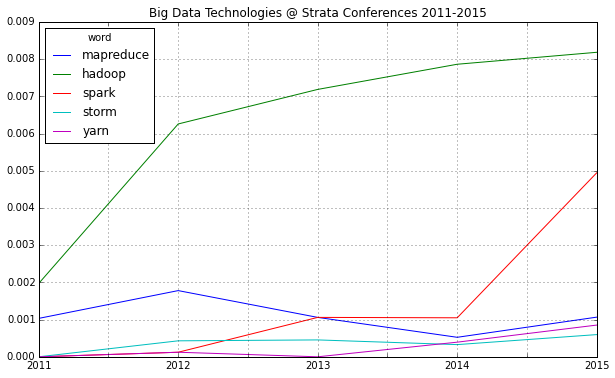
One thing immediately strikes: 2015 will be probably known as the “Spark Strata”:

strata_2015_technologies

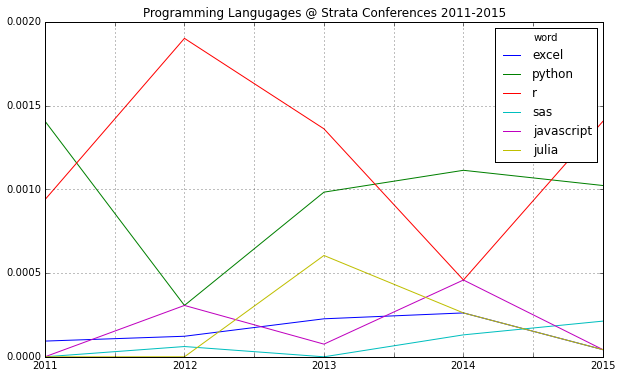
If you compare mentions of the major programming languages in data science, there’s another interesting find: R seems to have a comeback and Python may be losing some of its momentum:

strata_2015_languages

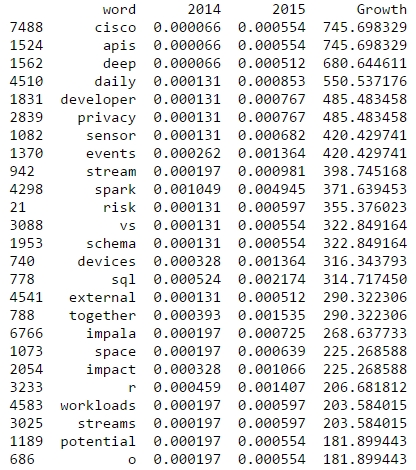
R is also among the rising topics if you look at the word frequencies for 2015 and 2014:

strata_2015_words

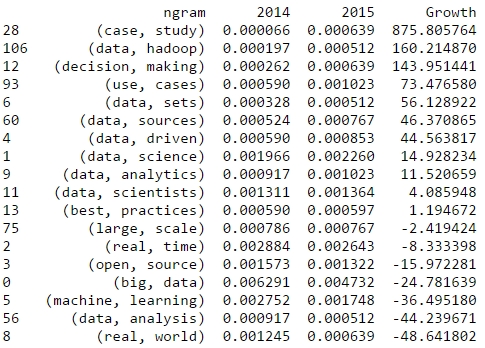
Now, let’s take a look at bigrams that have been gaining a lot of traction since the last Strata conference. From the following table, we could expect a lot more case studies than in the previous years:

strata_2015_ngrams

This analysis has been done with IPython and Pandas. See the approach in this notebook.

Looking forward to meeting you all at Strata Conference next week! I’ll be around all three days and always in for a chat on data science.

DLD Conference – what were Twitter users discussing?

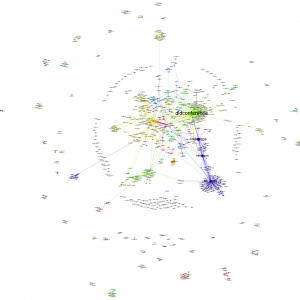
While I was taking a look at the network dynamics and relations of the Twitter conversations at the DLD conference in Munich, Salesforce and Radian6 took a more “traditional” approach and segmented the conversations in terms of topics, users and countries. While a tag cloud is able to give a first impression on the relevant content of the discussions, a semantic analysis goes much deeper and shows the relations between the terms used by the conference attendants. Here’s a look at the most important and most frequently connected words related to the Twitter hashtags “#DLD12” and “#DLD”:

The most frequently used words and related concepts have been the following:

See also: Networking at the DLD conference part 1 and part 2

Networking at the DLD conference

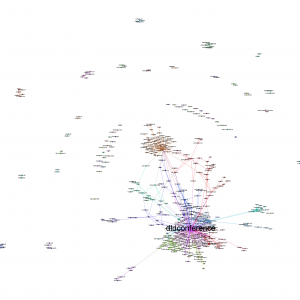
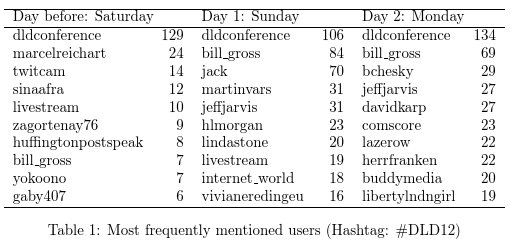
A rather traditional application of network analysis is taking a look at conference talk on social networks such as Twitter. Right now, Burda’s DLD conference in Munich is the best research object for this purpose – especially because Twitter’s CEO Jack Dorsey is one of the speakers. I began my tracking of conference on the day before. I thought it would be rather interesting to compare pre-conference and conference chatter in terms of the volume of buzz and the most influential people or accounts. So, here’s a look at the buzz up to Saturday, the night before the official conference launch:

Obviously, the activity is quite limited and the official account of the conference, @DLDConference, is the most frequently mentioned Twitter account (129 times) followed by @marcelreichart (24 times) who is one of the hosts. Other people who have been mentioned more than once are @sinaafra (12), @bill_gross (7) and @yokoono (7):

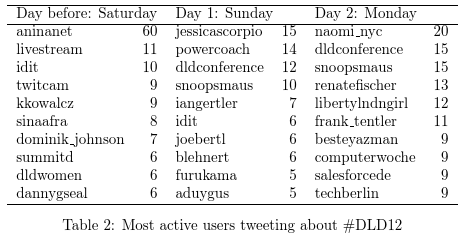
If we switch the perspective from the people most frequently mentioned to the most active people, suddenly there is a quite different set of Twitter users with aninanet (60 tweets), livestream (11) and idit (10) most frequently tweeting about “#DLD12”. Here’s the information in a bit more structured format:

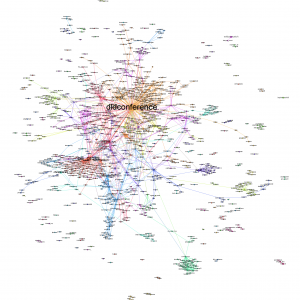
Now take a look at the next visualization that captures the Twitter activity from afternoon to midnight on the first DLD day: The difference to the first network is striking. Now, @DLDConference has lost some influence – which is good because it’s not a good sign if the official conference account is the only one posting Tweets about a conference. And there are new people who are mentioned very frequently: @DLDConference (106 mentions), @bill_gross (84), @jack (70), @martinvars (31) and @jeffjarvis (31). The most active users were @jessicascorpio (15 tweets), @powercoach (14) and @DLDconference (12).

The size of the nodes in this visualization is the account’s page rank. The higher the page rank the higher the probability of reaching this node by chance while traveling through the network. Nodes with a high page rank have a high influence in the network. Nodes with a very high page rank were: @DLDconference, @lindastone, @hlmorgan and @bill_gross. The width of the arrows reflects the number of times one Twitter account has mentioned or retweeted another account. The strongest links were: @powercoach mentioning @jack, @burda_news mentioning @DLDConference and @mammonaetheevil mentioning @alecjross.

Finally, here’s a quick glance at the network for Monday. All DLD-related tweets from 0:00 until 16:00 have been counted and analyzed. The network is getting more and more dense.

Tomorrow I’m posting another update with the remaining Monday and Tuesday tweets and I’ll take a look at the content posted by the users. Read the update in part 2 of the article.

Telling stories with network data: Instagram in China

One of the most interesting sources of social media data right now is the iPhone based image sharing platform Instagram. This social networking platform is based on images, which can be compared with Flickr, but with Instagram the global dimension is much more visible. And because of the seamless Twitter and Facebook integration, the networking component is stronger. And it has a great API 😉

The first thing that came to my mind when looking at the many options, the API is providing to developers, has been the tags. In the Instagram application, there is no separate field for tagging your (or other peoples’) images. Instead you would write it in the comment field as you would do in Twitter. But the API allows to fetch data by hashtags. After reading this fascinating article (and looking at the great images) in Monocle about the northern Chinese city of Harbin, I wanted to learn more about the visual representation of this city in Instagram.

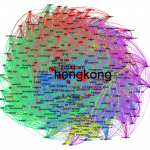
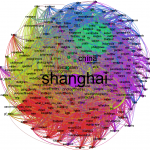
What I did was the following: I wrote a short Python program that fetched the 1.000 most recently posted images for any hashtag. As I could not get the two available Instagram Python modules to work properly, I wrote my own interface to Instagram based on pycurl. The data is then transformed into a network based on the co-occurence of hashtags for the images and saved in GraphML format with the Python module igraph. Other data (such as filters, users, locations etc.) that can be evaluated is saved in separate data sets. Here’s the network visualizations for China, Shanghai, Beijing, Hongkong, Shenzen and Harbin – not the whole network, but a reduced version only with the tags that were mentioned at least five times (click to enlarge):

I also calculated some interesting indicators for the six hashtags I explored:

The first thing to notice is that Harbin obviously is not as often being instagrammed as the Shanghai, Shenzhen, Hongkong or Beijing. An interesting indicator here is in the second data column: the daily number of images tagged with this location. Shenzhen seems to be the most active city with 3.4 images tagged “#shenzen”. Beijing is almost as active, while Shanghai is a bit behind. Finally, for Harbin, there’s not even one image every day. The unique tags is showing the diversity of hashtags used to describe images. Here, China is clearly in the lead. The next two indicators tell something about the connections between the tags: The density is calculated as the relation of actual to possible edges between the network nodes. Here, the smaller network of Harbin has the highest density and China and Shanghai the lowest. The average path length is a little below 2 for all hashtags.

Now, let’s take a look at the most frequently used hashtags:

What is interesting here: Harbin clearly does tell a story about snow, cold weather and a ice sculpture park, while Shanghai seems to be home for users frequently tagging themselves to advertise their instagramming skills (I marked the tags that refer to usernames with an asterisk). Most of the frequently used hashtags are Instagram lingo (instagood, instagram, ig, igers, instamood), refer to the equipment (iphonesia, iphoneography) or the region (china). Topical hashtags, that tell something about the city or the community can seldom be found in the top hashtags. Nonetheless, they are there. Here’s a selection of hashtags telling a story about the cities:

Finally, here is the most frequently liked image for each of the hashtags – to remind us that the numbers and networks only tell half the story. Enjoy and see if you can spot the ice sculptures in Harbin!

China:

Shanghai:

Beijing:

Hongkong:

Shenzhen:

Harbin: