How to analyze smartphone sensor data with R and the BreakoutDetection package

Yesterday, Jörg has written a blog post on Data Storytelling with Smartphone sensor data. Here’s a practical approach on how to analyze smartphone sensor data with R. In this example I will be using the accelerometer smartphone data that Datarella provided in its Data Fiction competition. The dataset shows the acceleration along the three axes of the smartphone:

  • x – sideways acceleration of the device
  • y – forward and backward acceleration of the device
  • z – acceleration up and down

The interpretation of these values can be quite tricky because on the one hand there are manufacturer, device and sensor specific variations and artifacts. On the other hand, all acceleration is measured relative to the sensor orientation of the device. So, for example, the activity of taking the smartphone out of your pocket and reading a tweet can look the following way:

  • y acceleration – the smartphone had been in the pocket top down and is now taken out of the pocket
  • z and y acceleration – turning the smartphone so that is horizontal
  • x acceleration – moving the smartphone from the left to the middle of your body
  • z acceleration – lifting the smartphone so you can read the fine print of the tweet

And third, there is gravity influencing all the movements.

So, to find out what you are really doing with your smartphone can be quite challenging. In this blog post, I will show how to do one small task – identifying breakpoints in the dataset. As a nice side effect, I use this opportunity to introduce an application of the Twitter BreakoutDetection Open Source library (see Github) that can be used for Behavioral Change Point analysis.

First, I load the dataset and take a look at it:

setwd("~/Documents/Datarella")
accel <- read.csv("SensorAccelerometer.csv", stringsAsFactors=F)
head(accel)

  user_id           x          y        z                 updated_at                 type
1      88 -0.06703765 0.05746084 9.615114 2014-05-09 17:56:21.552521 Probe::Accelerometer
2      88 -0.05746084 0.10534488 9.576807 2014-05-09 17:56:22.139066 Probe::Accelerometer
3      88 -0.04788403 0.03830723 9.605537 2014-05-09 17:56:22.754616 Probe::Accelerometer
4      88 -0.01915361 0.04788403 9.567230 2014-05-09 17:56:23.372244 Probe::Accelerometer
5      88 -0.06703765 0.08619126 9.615114 2014-05-09 17:56:23.977817 Probe::Accelerometer
6      88 -0.04788403 0.07661445 9.595961  2014-05-09 17:56:24.53004 Probe::Accelerometer

This is the sensor data for one user on one day:

accel$day <- substr(accel$updated_at, 1, 10)
df <- accel[accel$day == '2014-05-12' & accel$user_id == 88,]
df$timestamp <- as.POSIXlt(df$updated_at) # Transform to POSIX datetime
library(ggplot2)
ggplot(df) + geom_line(aes(timestamp, x, color="x")) + 
             geom_line(aes(timestamp, y, color="y")) + 
             geom_line(aes(timestamp, z, color="z")) + 
             scale_x_datetime() + xlab("Time") + ylab("acceleration")
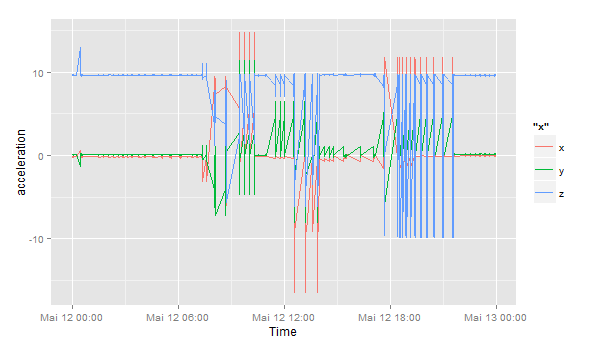
sensor_all

Let’s zoom in to the period between 12:32 and 13:00:

ggplot(df[df$timestamp >= '2014-05-12 12:32:00' & df$timestamp < '2014-05-12 13:00:00',]) +
  geom_line(aes(timestamp, x, color="x")) + 
  geom_line(aes(timestamp, y, color="y")) + 
  geom_line(aes(timestamp, z, color="z")) + 
  scale_x_datetime() + xlab("Time") + ylab("acceleration")
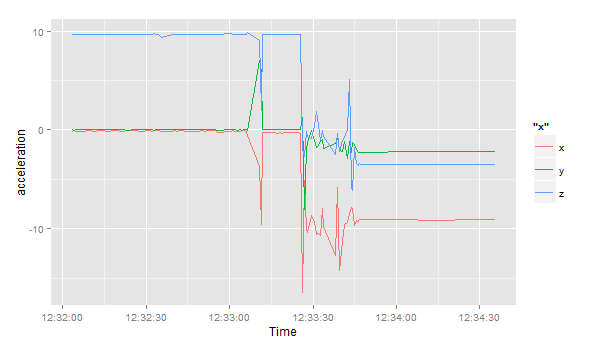
sensor_zoom

Then, I load the Breakoutdetection library:

install.packages("devtools")
devtools::install_github("twitter/BreakoutDetection")
library(BreakoutDetection)
bo <- breakout(df$x[df$timestamp >= '2014-05-12 12:32:00' & df$timestamp < '2014-05-12 12:35:00'], 
               min.size=10, method='multi', beta=.001, degree=1, plot=TRUE)
bo$plot

sensor_breakout

This quick analysis of the acceleration in the x direction gives us 4 change points, where the acceleration suddenly changes. In the beginning, the smartphone seems to lie flat on a horizontal surface – the sensor is reading a value of around 9.8 in positive direction – this means, the gravitational force only effects this axis and not the x and y axes. Ergo: the smartphone is lying flat. But then things change and after a few movements (our change points) the last observation has the smartphone on a position where the x axis has around -9.6 acceleration, i.e. the smartphone is being held in landscape orientation pointing to the right.

Anomaly Detection with Wikipedia Page View Data

Today, the Twitter engineering team released another very interesting Open Source R package for working with time series data: “AnomalyDetection“. This package uses the Seasonal Hybrid ESD (S-H-ESD) algorithm to identify local anomalies (= variations inside seasonal patterns) and global anomalies (= variations that cannot be explained with seasonal patterns).

As a kind of warm up and practical exploration of the new package, here’s a short example on how to download Wikipedia PageView statistics and mine them for anomalies (inspired by this blog post, where this package wasn’t available yet):

First, we install and load the necessary packages:

library(RJSONIO)
library(RCurl)
library(ggplot2)
install.packages("devtools")
devtools::install_github("twitter/AnomalyDetection")
library(AnomalyDetection)

Then we choose an interesting Wikipedia page and download the last 90 days of PageView statistics:

page <- "USA"
raw_data <- getURL(paste("http://stats.grok.se/json/en/latest90/", page, sep=""))
data <- fromJSON(raw_data)
views <- data.frame(timestamp=paste(names(data$daily_views), " 12:00:00", sep=""), stringsAsFactors=F)
views$count <- data$daily_views
views$timestamp <- as.POSIXlt(views$timestamp) # Transform to POSIX datetime
views <- views[order(views$timestamp),]

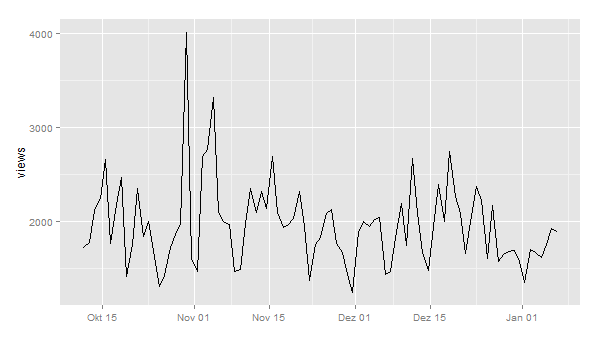
I also did some pre-processing and transformation of the dates in POSIX datetime format. A first plot shows this pattern:

ggplot(views, aes(timestamp, count)) + geom_line() + scale_x_datetime() + xlab("") + ylab("views")

wikipedia_views_USA

Now, let’s look for anomalies. The usual way would be to feed a dataframe with a date-time and a value column into the AnomalyDetection function AnomalyDetectionTs(). But in this case, this doesn’t work because our data is much too coarse. It doesn’t seem to work with data on days. So, we use the more generic function AnomalyDetectionVec() that just needs the values and some definition of a period. In this case, the period is 7 (= 7 days for one week):

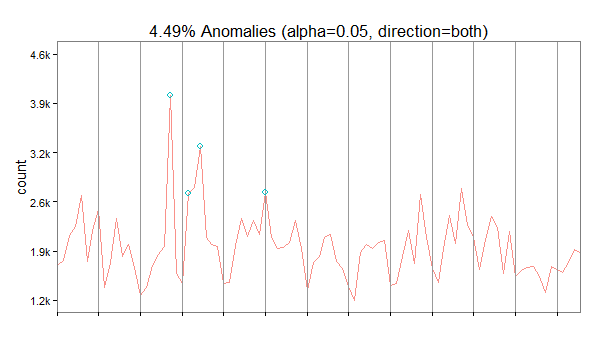
res = AnomalyDetectionVec(views$count, max_anoms=0.05, direction='both', plot=TRUE, period=7)
res$plot

wikipedia_anomalies_usa

In our case, the algorithm has discovered 4 anomalies. The first on October 30 2014 being an exceptionally high value overall, the second is a very high Sunday, the third a high value overall and the forth a high Saturday (normally, this day is also quite weak).

The Top 7 Beautiful Data Blog Posts in 2014

Domo_After2014 was a great year in data science – and also an exciting year for me personally from a very inspirational Strata Conference in Santa Clara to a wonderful experience of speaking at PyData Berlin to founding the data visualization company DataLion. But it also was a great year blogging about data science. Here’s the Beautiful Data blog posts our readers seemed to like the most:

  1. Datalicious Notebookmania – My personal list of the 7 IPython notebooks I like the most. Some of them are great for novices, some can even be challenging for advanced statisticians and datascientists
  2. Trending Topics at Strata Conferences 2011-2014 – An analysis of the topics most frequently mentioned in Strata Conference abstracts that clearly shows the rising importance of Python, IPython and Pandas.
  3. Big Data Investment Map 2014 – I’ve been tracking and analysing the developments in Big Data investments and IPOs for quite a long time. This was the 2014 update of the network mapping the investments of VCs in Big Data companies.
  4. Analyzing VC investment strategies with Crunchbase data – This blog post explains the code used to create the network.
  5. How to create a location graph from the Foursquare API – In this post, I explain a way to make sense out of the Foursquare API and to create geospatial network visualizations from the data showing how locations in a city are connected via Foursquare checkins.
  6. Text-Mining the DLD Conference 2014 – A very similar approach as I used for the Strata conference has been applied to the Twitter corpus refering to Hubert Burda Media DLD conference showing the trending topics in tech and media.
  7. Identifying trends in the German Google n-grams corpus – This tutorial shows how to analyze Big data-sets such as the Google Book ngram corpus with Hive on the Amazon Cloud.

Text-Mining the DLD Conference 2014

Once a year, the cosmopolitan digital avantgarde gathers in Munich to listen to keynotes on topics all the way from underground gardening to digital publishing at the DLD, hosted by Hubert Burda. In the last years, I did look at the event from a network analytical perspective. This year, I am analyzing the content, people were posting on Twitter in order to make comparisons to last years’ events and the most important trends right now.

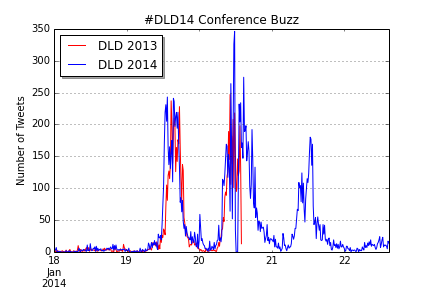
To do this in the spirit of Street Fighting Trend Research, I limited myself to openly available free tools to do the analysis. The data-gathering part was done in the Google Drive platform with the help of Martin Hawksey’s wonderful TAGS script that is collecting all the tweets (or almost all) to a chosen hashtag or keyword such as “#DLD14” or “#DLD” in this case. Of course, there can be minor outages in the access to the search API, that appear as zero lines in the data – but that’s not different to data-collection e.g. in nanophysics and could be reframed as adding an extra challenge to the work of the data scientist 😉 The resulting timeline of Tweets during the 3 DLD days from Sunday to Tuesday looks like this:

Twitter Buzz for #DLD14

You can clearly see three spikes for the conference days, the Monday spike being a bit higher than the first. Also, there is a slight decline during lunch time – so there doesn’t seem to be a lot food tweeting at the conference. To produce this chart (in IPython Notebook) I transformed the Twitter data to TimeSeries objects and carefully de-duplicated the data. In the next step, I time shifted the 2013 data to find out how the buzz levels differed between last years’ and this years’ event (unfortunately, I only have data for the first two days of DLD 2013.

DLD14_Buzz_Comp_Comparison

The similarity of the two curves is fascinating, isn’t it? Although there still are minor differences: DLD14 began somewhat earlier, had a small spike at midnight (the blogger meeting perhaps) and the second day was somewhat busier than at DLD13. But still, not only the relative, but also the absolute numbers were almost identical.

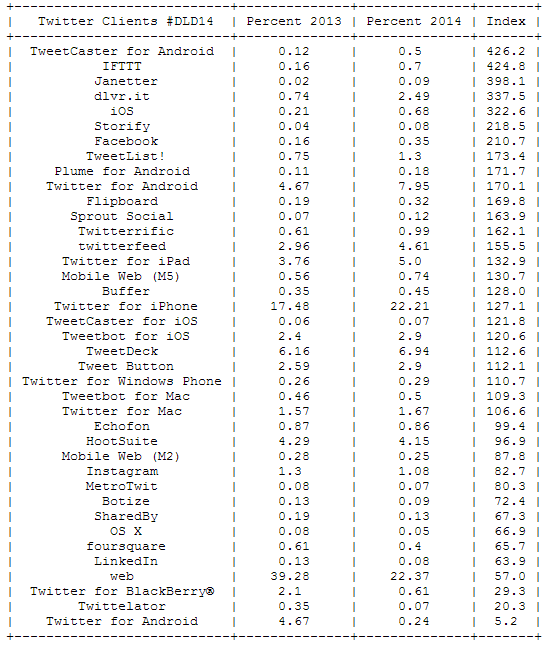
Now, let’s take a look at the devices used for sending Tweets from the event. Especially interesting is the relation between this years’ and last years’ percentages to see which devices are trending right now:

DLD14_Clients

The message is clear: mobile clients are on the rise. Twitter for Android has almost doubled its share between 2013 and 2014, but Twitter for iPad and iPhone have also gained a lot of traction. The biggest losers is the regular Twitter web site dropping from 39 per cent of all Tweets to only 22 per cent.

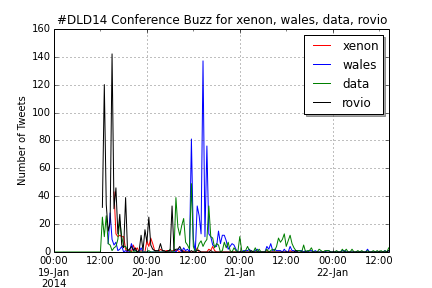
The most important trending word is “DLD14”, but this is not surprising. But the other trending words allow deeper insights into the discussions at the DLD: This event was about a lot of money (Jimmy Wales billion dollar donation), Google, Munich and of course the mobile internet:

DLD14_Words

Compare this with the top words for DLD 2013:

DLD13_Words

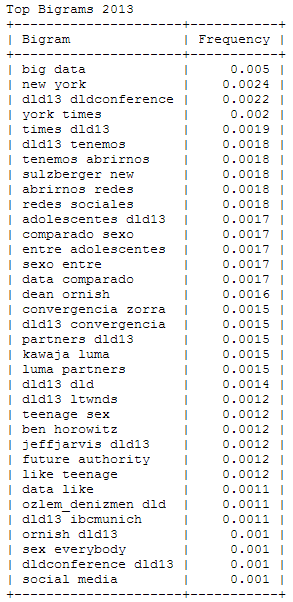
Wait – “sex” among the 25 most important words at this conference? To find out what’s behind this story, I analyzed the most frequently used bigrams or word combinations in 2013 and 2014:

DLD13_Bigrams DLD14_Bigrams

With a little background knowledge, it clearly shows that 2013’s “sex” is originating from a DJ Patil quote comparing “Big Data” (the no. 1 bigram) with “Teenage Sex”. You can also find this quotation appearing in Spanish fragments. Other bigrams that were defining the 2013 DLD were New York (Times) and (Arthur) Sulzberger, while in 2014 the buzz focused on Jimmy Wales, Rovio and the new Xenon processor and its implications for Moore’s law. In both years, a significant number of Tweets are written in Spanish language.

DLD14_Buzzwords_Comp

UPDATE: Here’s the  IPython Notebook with all the code, this analysis has been based on.

Animated Twitter Networks

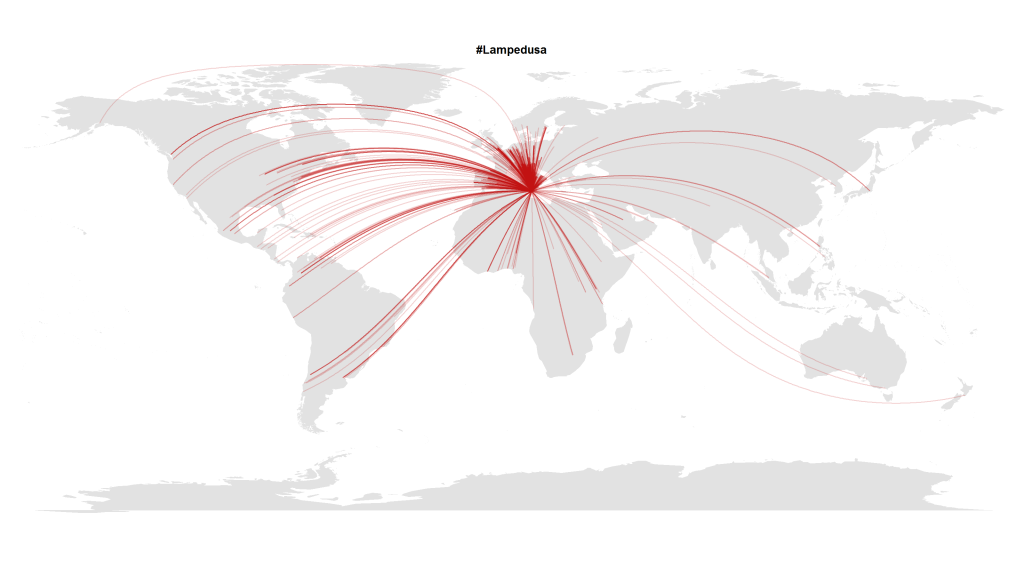
In this blogpost I presented a visualization made with R that shows how almost the whole world expresses its attention to political crises abroad. Here’s another visualization with Tweets in October 2013 that referred to the Lampedusa tragedy in the Mediterranean.

#Lampedusa on Twitter

But this transnational public space isn’t quite as static as it seems on these images. To show how these geographical hashtag links develop over time, I analyzed the timestamps of the (geo-coded) Tweets mentioning the hashtag #lampedusa. This is the resulting animation showing the choreography of global solidarity:

The code is quite straightforward. After collecting the Tweets via the Twitter Streaming API e.g. with Pablo Barberá’s R package streamR, I quantized the dates to hourly values and then calculated the animation frame by frame inspired by Jeff Hemsley’s approach.

One trick that is very helpful when plotting geospatial connections with great circles is the following snippet that correctly assembles lines that cross the dateline:

library("geosphere")
for (i in 1:length(l$long)) {
inter <- gcIntermediate(c(l$long[i], l$lat[i]), c(12.6, 35.5), n=500, addStartEnd=TRUE, breakAtDateLine=TRUE) if (length(inter) > 2) {
lines(inter, col=col, lwd=l$n[i])
} else {
lines(inter[[1]], col=col, lwd=l$n[i])
lines(inter[[2]], col=col, lwd=l$n[i])
}
}

Cosmopolitan Public Spaces

Mentions of the Gezi Park protests on Twitter

In my PhD and post-doc research projects at the university, I did a lot of research on the new cosmopolitanism together with Ulrich Beck. Our main goal was to test the hypothesis of an “empirical cosmopolitanization”. Maybe the term is confusing and too abstract, but what we were looking for were quite simple examples for ties between humans that undermine national borders. We were trying to unveil the structures and processes of a real-existing cosmopolitanism.

I looked at a lot of statistics on transnational corporations and the evolution of transnational economic integration. But one of the most exciting dimensions of the theory of cosmopolitanism is the rise of a cosmopolitan public sphere. This is not the same as a global public that can be found in features such as world music, Hollywood blockbusters or global sports events. A cosmopolitan public sphere refers to solidarity with other human beings.
When I discovered the discussions on Twitter about the Gezi Park protests in Istanbul, this kind of cosmopolitan solidarity seems to assume a definite form: The lines that connect people all over Europe with the Turkish protesters are not the usual international relations, but they are ties that e.g. connect Turkish emigrants, political activists, “Wutbürger” or generally political aware citizens with the events in Istanbul. Because only about 1% of all tweets carry information about the geo-position of the user, you should imagine about 100 times more lines to see the true dimension of this phenomenon.

Mapping a Revolution

Twitter has become an important communications tool for political protests. While mass media are often censored during large-scale political protests, Social Media channels remain relatively open and can be used to tell the world what is happening and to mobilize support all over the world. From an analytic perspective tweets with geo information are especially interesting.

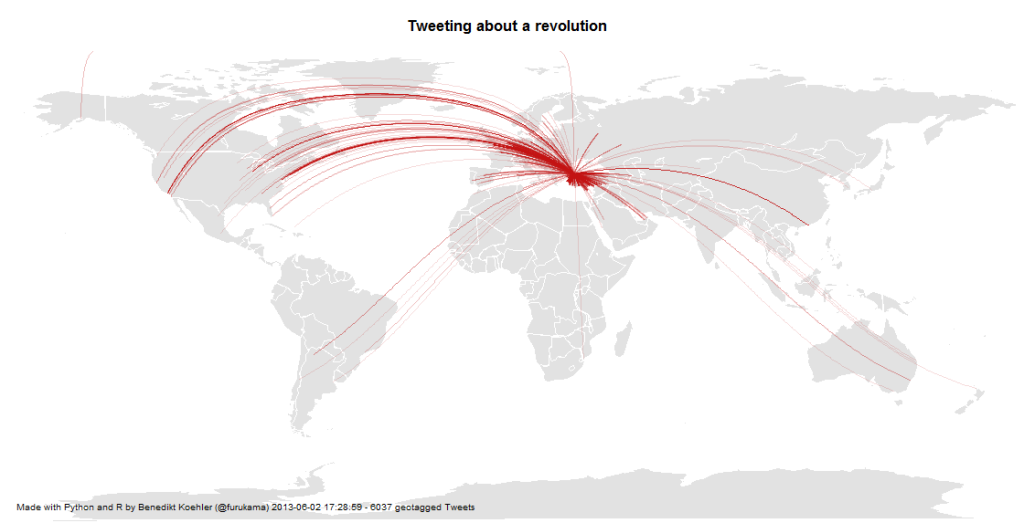
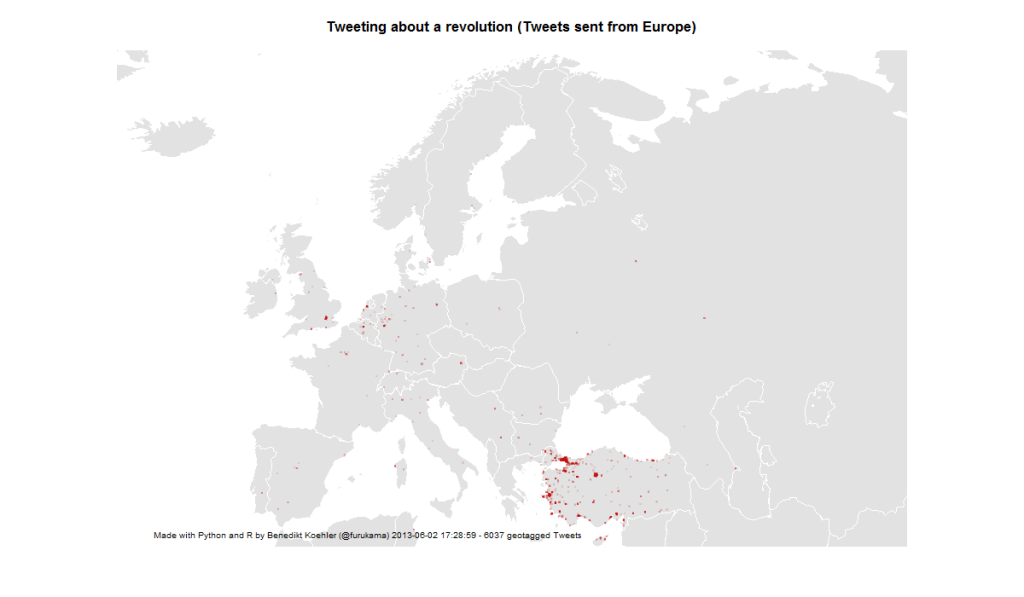
Here’s some maps I did on the basis of ~ 6,000 geotagged tweets from ~ 12 hours on 1 and 2 Jun 2013 referring to the “Gezi Park Protests” in Istanbul (i.e. mentioning the hashtags “occupygezi”, “direngeziparki”, “turkishspring”* etc.). The tweets were collected via the Twitter streaming API and saved to a CouchDB installation. The maps were produced by R (unfortunately the shapes from the map package are a bit outdated).

*”Turkish Spring” or “Turkish Summer” are misleading terms as the situation in Turkey cannot be compared to the events during the “Arab Spring”. Nonetheless I have included them in my analysis because they were used in the discussion (e.g. by mass media twitter channels) Thanks @Taksim for the hint.

International Attention for Gezi Park protests 1-2 Jun

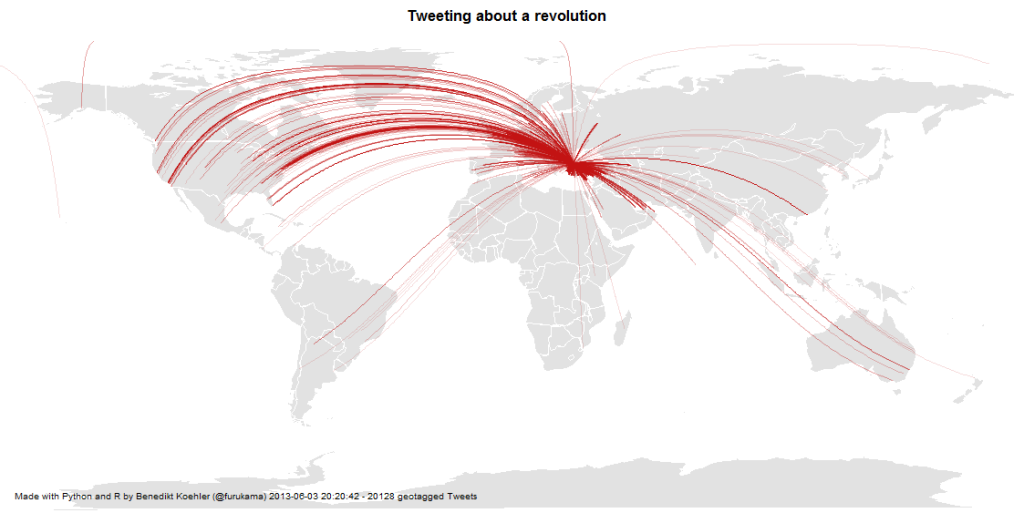
On the next day, there even was one tweet mentioning the protests crossing the dateline:

International Attention for Gezi Park protests 1-3 Jun

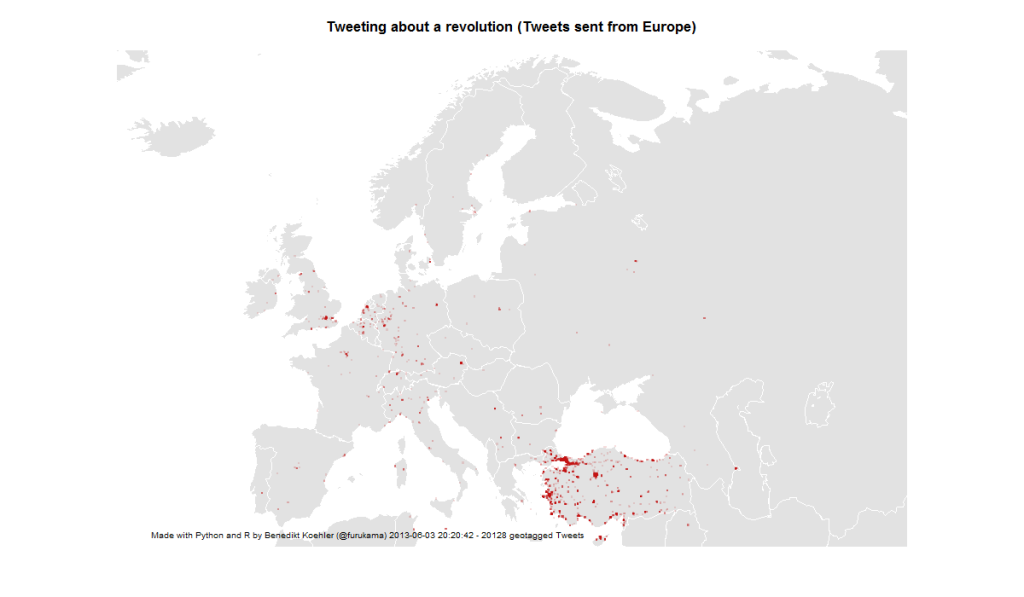
First, I took a look at the international attention (or even cosmopolitan solidarity) of the events in Turkey. The following maps are showing geotagged tweets from all over the world and from Europe that are referring to the events. About 1% of all tweets containing the hashtags carry exact geographical coordinates. The fact, that there are so few tweets from Germany – a country with a significant population of Turkish immigrants – should not be overrated. It’s night-time in Germany and I would expect a lot more tweets tomorrow.

European Attention for Gezi Park protests 1-2 Jun

14,000 geo-tagged tweets later the map looks like this:

European Attention for Gezi Park protests 1-3 Jun

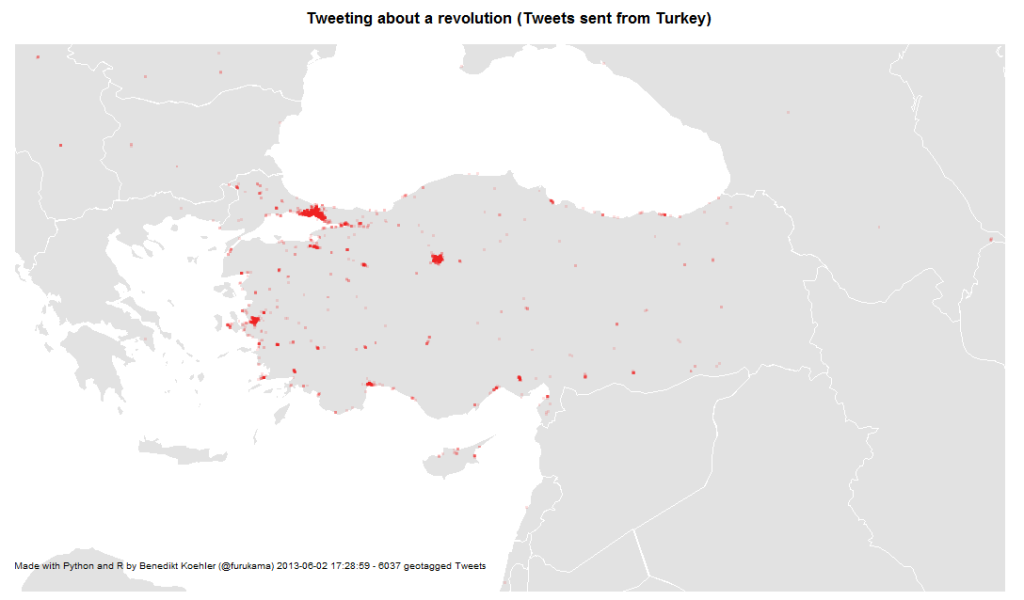
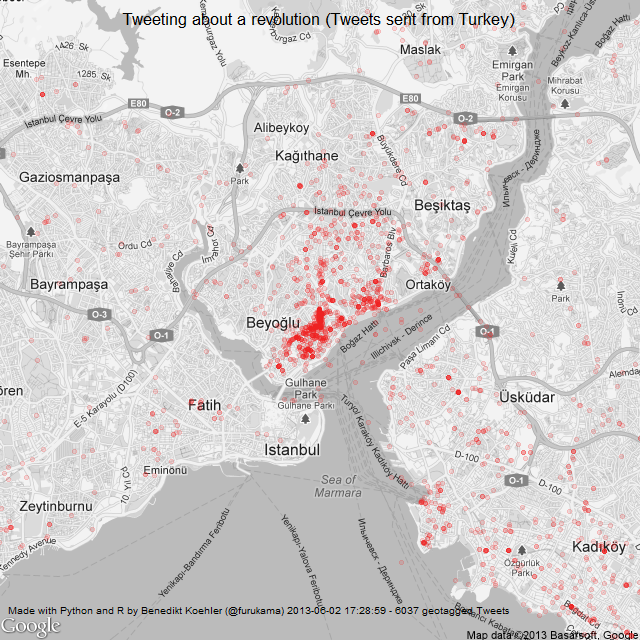
The next map is zooming in closer to the events: These are the locations in Turkey where tweets were sent with one of the hashtags mentioned above. The larger cities Istanbul, Ankara and Izmir are active, but tweets are coming from all over the country:

Turkish Tweets about the Gezi Park protests 1-2 Jun

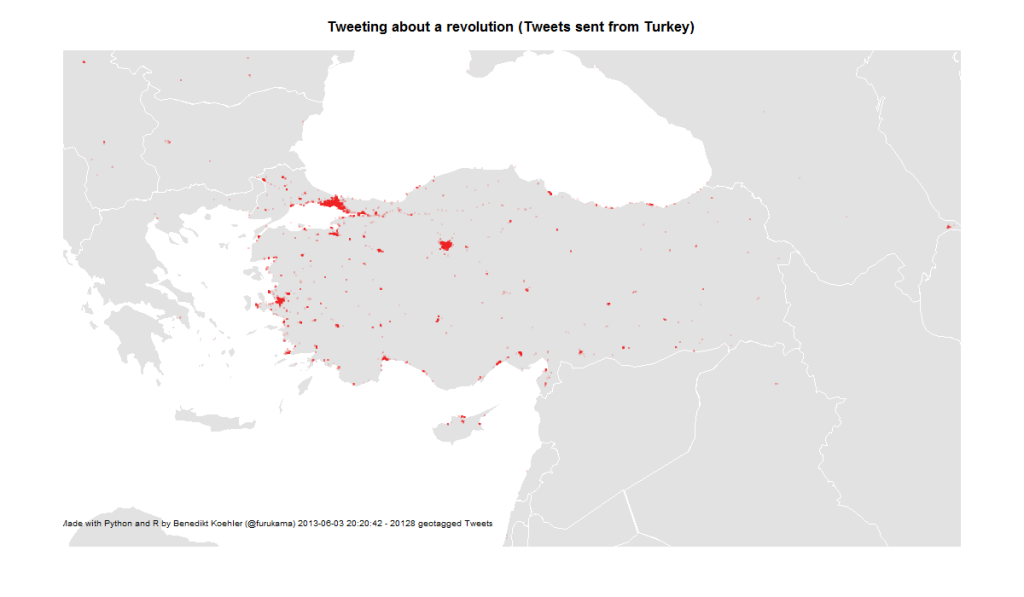
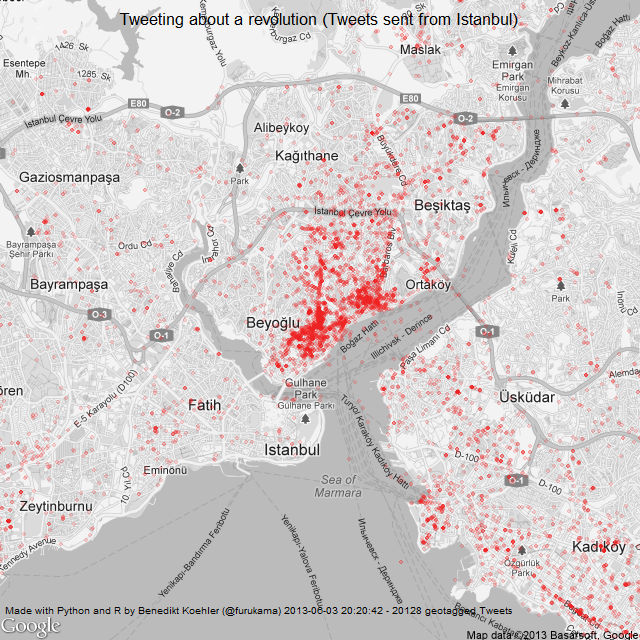
On June 3rd, the activity has spread across the country:

Turkish Tweets about the Gezi Park protests 1-3 Jun

And finally, here’s a look at the tweet locations in Istanbul. The map is centered on Gezi Park – and the activity on Twitter as well:

Istanbul Tweets about Gezi Park protests 1-2 Jun

Here’s the same map a day later (I decreased the size of the dots a bit while the map is getting clearer):

Istanbul Tweets about Gezi Park protests 1-3 Jun

The R code to create the maps can be found on my GitHub.

The immutability paradigm – or: how to add the “fourth dimension” to our data

Our brain is wired to experiencing the world as one consistent model of reality. New data we interpret either as confirmation of the model or as an update to replace one of its parameters with a new value. Our sensory organs also reduces the incoming stimuli, drop most of the impressions, preprocess what is identified as signals to simple patterns that are propagated to our mind. What we remember as the edge of our table – a straight line, limiting the surface – was in fact received as a fine grid of multicoloured pixels by our retina. For sake of saving computation and storage power, and to keep a stable, consistent view, we forsake the richness of information. And we use to build our data bases to work exactly that way.

One of the realy disruptive shifts in our business is imo to break this paradigm: “Make your source of truth immutable.” Nathan Marz (who has just yesterday left the Twitter team) tells us to have a base layer of incoming data. Nothing here gets updated or changed. New records are just attached. From such an immutable data source, we can reconstruct the state of our data set at any given point of time in the past; even if someone messes with the database, we could roll back without the need to reset everything. This rather unstructured worm is of course not fit to get access to information with low latency. In Marz’ paradigm it is the “source of truth”, is a repository to feed into a second level of more “classic” data bases that provides precalculated, prepopulated tables that can be accessed at real time.

What Nathan Marz advocates as a way to make data bases more tolerant against human fault entails in fact a deep, even philosophical perspective. With the classic database we would keep master data and transaction data in different tables. We would regard a master record as something that should provide one consistent view on the object recorded. Take a clients data base of some retailer: Address or payment information we would expect to be a static property of the client, to be kept “up to date” – if the person moves, we would update the record. Other information we would even regard as unchangeable: Name, gender or birthday for example. This is exactly how we would be looking at the world if we had remained at the state of the naive phenomenology of the early modern ages. Concepts like “identity” of a human being reflect this integral perspective of an object with master properties – ideas like “character” (individual or even bound to ethnicity or nation) stem from this taking an object as in reality being independent from the temporal state of data that we could comprehend. (Please excuse my getting rather abstract now.)

Temporal logic was developed not in philosophy but rather in computer science. The idea is, that those apodictical clauses of “true” or “false” – tertium non datur” – that we are used to deal with in propositional calculus since the time of the ancient Greeks, would not be correctly applicable to real world systems like people interacting with other in time. – The “classic” example would be a sentence like “I am hungry” that would never necessaryly be true or false because it would depend on the specific circumstances at that point in time when I would have stated it; nevertheless it should be regarded as a valid property to describe me at that time.

In such way, the immutable database might not reflect our gut feeling about reality, but it certainly is a far more accurate “source of truth”, and not only because it is more tolerant against human operators tampering with the data.

With the concept of one immutable source of truth, this “master record” is just a view on the data at one given point in time. We would finally have “the forth dimension” in our data.

Social Sensors

“So, what’s the mood of America?”
Interface, 1994

One of the most fascinating novels so far on data-driven politics is Neal Stephenson’s and J. Frederick George’s “Interface“, first published in 1994. Although written almost 20 years ago, many of the technologies discussed in this book, would still be cutting edge if employed right now in 2013. One of the most original political devices is the PIPER wristwatch, a device for watching political content such as debates or candidate’s news coverage, while analyzing the wearers’ emotional reaction to these images in real-time by measuring bodily reactions such as pulse, blood pressure or galvanic skin response. This device is a miniaturized polygraph embedded in a controlled political feedback loop.

Social sensors on Twitter for conversations and trends in modern arts

What’s really interesting about the PIPER project: These sensors are not applied to all Americans or to a sample of them, but to a rather small number of types. Here are some examples from a rather extensive list of the types that are monitored this way (p. 360-1):

  • irrelevant mouth breather
  • 400-pound tab drinker
  • burger-flipping history major
  • bible-slinging porch monkey
  • pretentious urban-lifestyle slave
  • formerly respectable bankruptcy survivor

In the novel, the interface of this technology is described as follows:

By examining those graphs in detail, Ogle could assess the emotional status of any one of the PIPER 100. But they provided more detail than Ogle could really handle during the real-time stress of a major campaign event. So Aaron had come up with a very simple, general color-coding scheme […] Red denoted fear, stress, anger, anxiety. Blue denoted negative emotions centered in higher parts of the brain: disagreement, hostility, a general lack of receptiveness. And green meant that the subject liked what they saw. (p. 372)

This immediately grabbed my attention because this is exactly what we are doing in advanced market research projects at the moment: Segmenting a population (in this case: the US electorate) in different personae that represent a larger and more important relevant part of the population under study. And a similar approach is used in innovation research, where one would also focus on “lead-users” that are ahead of their peers when it comes to the identification and experimentation with trends in their respective subject.

Quite recently, this kind of approach has surfaced in various academic publications on Twitter analysis and prediction under the name of “social sensors” (e.g. Sakaki, Okazaki and Matsuo on Twitter earthquake detection or Uddin, Amin, Le, Abdelzaher, Szymanski and Guyen on the right choice of Twitter sensors). The idea is, not to monitor the whole Twitter firehose or everything that is being posted about some hashtag (this would be the regular Social Media Monitoring approach), but to select a smaller number of Twitter accounts that have a history of delivering fast and reliable information.

Algorithmic Glass Bead Games – Why predicting Twitter trends will not change the world

The last hours, I’ve seen a lot of tweets mentioning this great new algorithm by MIT professor Devavrat Shah. The UK Wired, The Verge, Gigaom, The Atlantic Wire and Forbes all posted stories on this fantastic discovery. And this has only been the weekend. Starting next week, there will be a lot more articles celebrating this breakthrough in machine learning.

At first, I was very enthusiastic as well and tweeted the MIT press release. A new algorithm – great stuff! But then slowly, I began to think about this whole thing. This new algorithm claims to predict trending topics on Twitter. But this is a lot different from an algorithm predicting e.g. the outcome of presidential elections or other external events. Trending topics are nothing more than the result of an algorithm themselves:

Trends are determined by an algorithm and are tailored for you based on who you follow and your location. This algorithm identifies topics that are immediately popular, rather than topics that have been popular for a while or on a daily basis, to help you discover the hottest emerging topics of discussion on Twitter that matter most to you.

So, what Shah et al developed is an algorithm that is predicting the outcome of an algorithm. A lot of the coverage suggests that this new algorithm could be very useful for Twitter – because then they would not have to wait for the results of their own algorithm that is defining trends but could use the much brand new algorithm that gives the results 1.5 hours in advance:

The algorithm could be of great interest to Twitter, which could charge a premium for ads linked to popular topics.

What’s next? A Stanford professor that develops an algorithm that can predict the outcome of the Shah algorithm some 1.5 hours in advance? Or what about Google? Maybe someone will invent an algorithm predicting the PageRank for web pages? Oh, wait, something like this has already been invented. Maybe you’ll better know this under its acronym “SEO” or “Search Engine Optimization”.

How content is propagated might tell what it’s about

Memes – images, jokes, content snippets that get spread virally on the net – have been a popular topic in the Net’s pop culture for some time. A year ago, we started thinking about, how we could operationalise the Meme-concept and detect memetic content. Thus we started the Human Meme Project (the name an innuendo on mixing culture and genetics). We collected all available links to images that had been posted on social networks together with the meta data that would go with these posts, like date and time, language, count of followers, etc.

With referers to some 100 million images, we could then look into the interesting question: how would “the real memes” get propagated and could we see differences in certain types of images regarding their pattern of propagation. Soon we detected several distinct pathes of content being spread. And after having done this for a while, these propagation patterns could tell us often more facts about an image than we could have extracted of the caption or the post’s text.

Case 1: detection of “Astroturfing” and “Twitter-bombing

Of course this kind of analysis is not limited to pictorial content. A good example how the insights of propagation analyses can be used is shown in sciencenews.org. Astroturfing or Twitter-bombing – flooding discussions with messages that would seam to be angry and very critical towards some candidate or some position, and would look like authentic rage at first sight, although in reality it would be machine generated Spam – could pose a thread to political discussion in social networks and even harm democratic elections.
This new type of “Black PR”, however can be detected by analysing the propagation pattern.

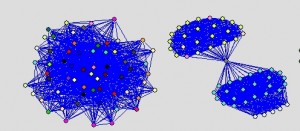
Two examples of how memetic images are shared within communities. The vertices represent the shared images, edges connect images posted by the same user. The left graph results of a set of images that get propagated with almost equal probability in the supporting community, the right graph shows an image that made its path into two disjoint communities before getting further spread.

Case 2: identification of insurgent pamphletesy

After the first wave of uprising in Northern Africa, the remaining regimes became more cautious and installed many kinds of surveillance and filter technologies on the Net. To avoid the governmental crawlers, insurgents started to write their pamphletes by hand in some calligraphic type that no OCR would decipher. These handwritten notes would get photographed and then posted on the social web with some insuspicous text. But what might have tricked out spooks in the good old times, would not deceive the data scientist. These calls for protests, although artfully disguised, leave a distinct trace on their way through Facebook, Twitter and the like. It is not our intention to deliver our findings to the tyrants to close their gap in surveillance. We are in fact convinced that similar approaces are already in place in many authoritarian regimes (and maybe some democracies as well). Thus we think the fact should be as widespread and recognised as possible.

Both examples show again, that just looking at the containers and their dynamic can be as fruitful to tell about their content, than a direct approach.

Twitter Germany will be based in Berlin – Taking a look at the numbers

What I really love about Twitter is that everything they do seems to be data-based. They’re so data-driven, they even analyze the ingredients of their lunch to ensure everyone at the company is living a healthy lifestyle. So, the decision for Berlin as their German headquarter cannot be a random or value-based decision. I bet, there’s been a lot of numbers crunching before announcing their new office. Let’s try and reverse-engineer this decision.

As a data basis I collected 4,377,832 tweets more or less randomly by connecting to the streaming API. Then I pulled all users mentioning one of the 30 leading German cities from Berlin to Aachen in their location field. Where there were Umlauts involved, I allowed for multiple variants, e.g. “Muenchen”, “Munchen” or “Munich” for “München”. Now I have 3,696 Twitter users from Germany that posted one or more tweets during the sample interval. That’s 0.08% of the original sample size. Although that’s not as much as I would have expected, let’s continue with the analysis.

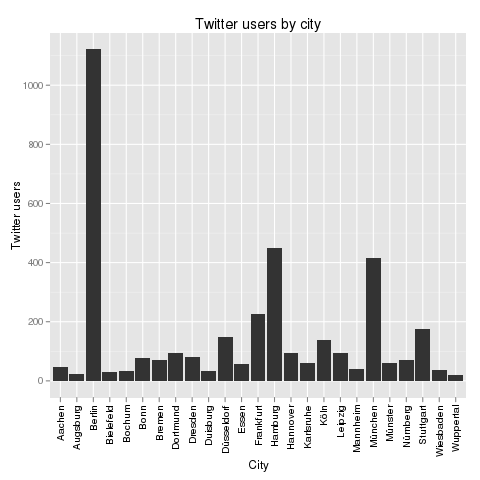
The first interesting thing is the distribution of the Twitter users by their cities. Here’s the result:

Twitter users by city

One thing should immediately be clear from this chart: Only Berlin, Hamburg and Munich had a real chance of becoming Twitter’s German HQ. The other cities are just Twitter ghost towns. In the press, there had been some buzz about Cologne, but from these numbers, I’d say that could only have been desinformation or whishful thinking.

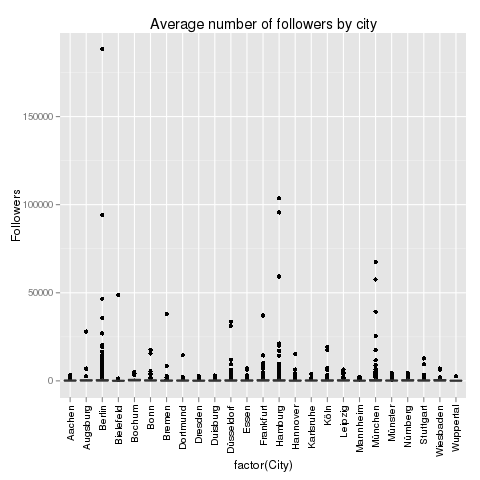
The next thing to look at is the influence of Twitter users in different German cities. Here’s a look at the follower data:

Average numbers of followers by city

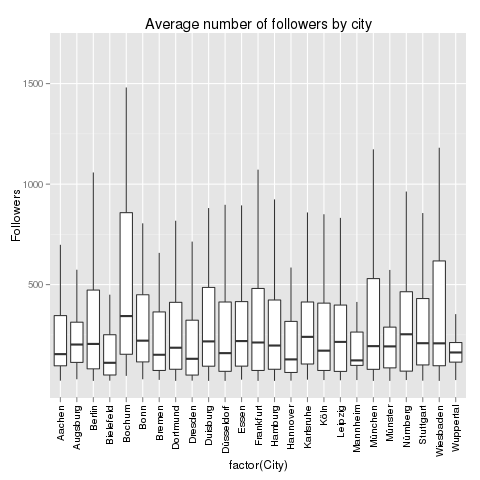
This does not help a lot. The distribution is heavily distorted by the outliers: Some Twitter users have a lot more followers than others. These Twitter users are marked by the black dots above the cities. But one thing is interesting: Berlin, Hamburg and Munich not only have the most Twitter users in our sample, but also the most and the highest outliers. With the outliers removed, the chart looks like this:

Average number of followers by city

The chart not only shows the median number of followers, but also the distribution of the data. Berlin, that should be clear from this chart, is not the German city where the Twitter users with most followers hail from. This should be awarded to Bochum (355 followers), Nuremberg (258 followers) or Augsburg (243 followers). But these numbers are not very reliable as the number of cases is quite low for these cities. If we focus on the Big 3, then Berlin is leading with 223 followers, then Munich with 209 followers and finally Hamburg with 200 followers. But it’s a very close race.

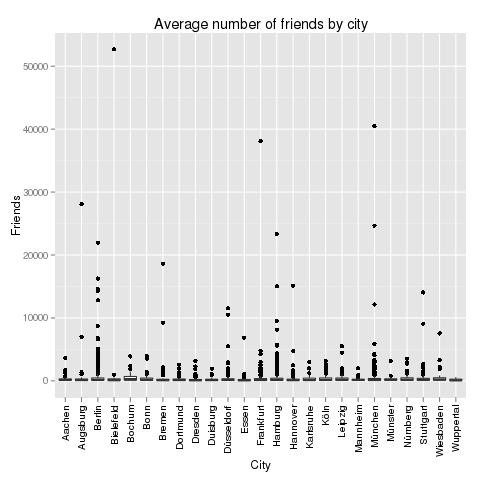
Next up, the number of friends. Which German city is leading the average number of friends on Twitter?

Average number of friends by city

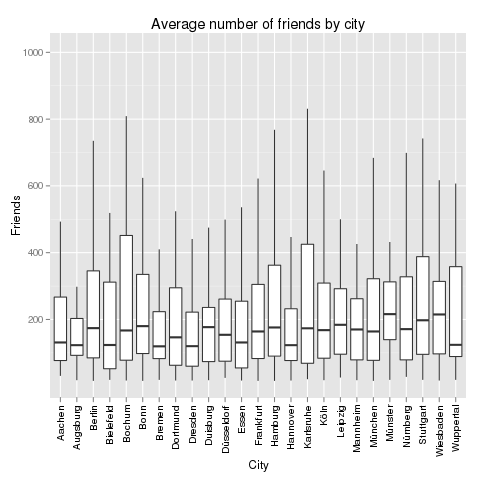
This chart is also distorted by outliers, but here it’s different cities: The user in the sample who is following the largest number of friends is located in Bielefeld. Of all things! Now, let’s remove the outliers:

Average number of friends by city

The cities with the larges average number of friends are: Bochum (again! 286 friends), Wiesbaden (224 friends) and Leipzig (208 friends). Our Big 3 are performing as follows: Berlin (183 friends), Hamburg (183 friends) and Munich (160 friends). Let’s take a look at the relation between followers and friends:

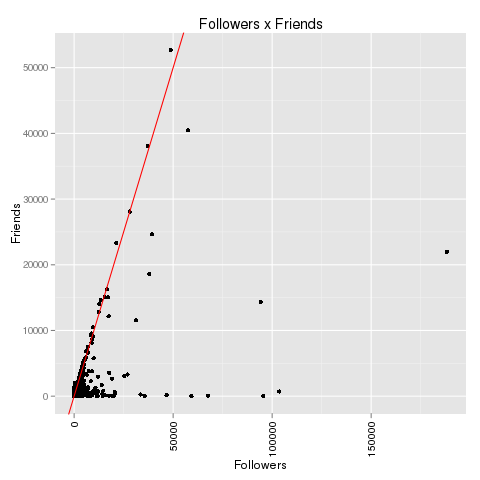
Followers x Friends

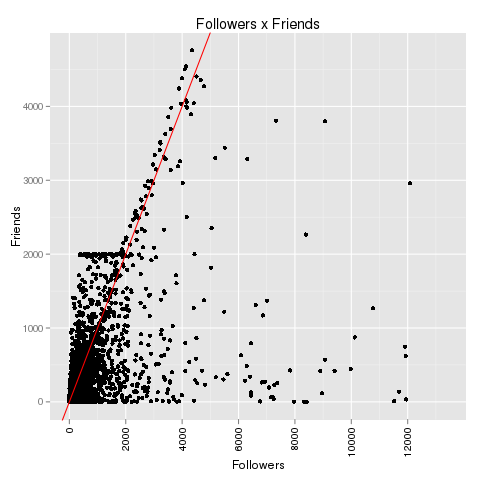
If we zoom in a bit on the data we can reproduce the “2000 phenomenon”:
2000 phenomenon

There clearly is some kind of artificial barrier at 2,000 friends on Twitter. Accounts that have between 100 and 2,000 followers never follow more than 2,000 followers. Most frequently, they follow just a little below of 2,000 people. After they gathered 2,000 followers themselves, this barrier has been broken and the maximal number of friends seems to grow with the number of followers. There’s only speculation about this phenomenon, but one of the most convincing explanation is: We are looking at spam bots that are programmed to stay below 2,000 friends until they have gathered more than 2,000 followers. Maybe Twitter has some spam fighting algorithms that are focusing at the 2,000 line. Update: See explanation in the comments to this article: Behind this anomaly is Twitter’s spam-fighting barrier that only allows 2,000 friends up to 2,000 followers. Beyond this, the limit for the maximum number of friends is limited by the number of followers + 10%.

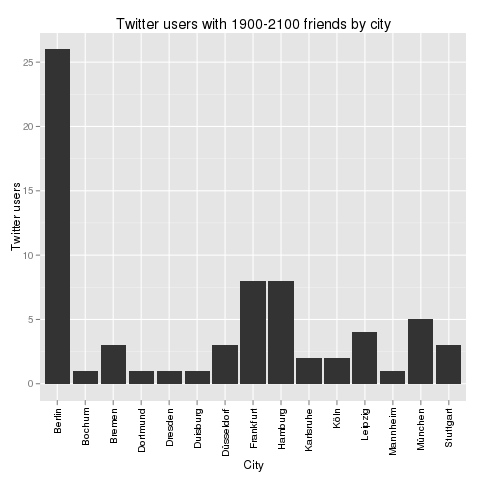
If those users are bots, then which city is bot capital? Let’s take a look at all Twitter users that have between 1,900 and 2,100 friends and segment them by city:

Twitter users by city

Again, Berlin is leading. But how do these numbers relate to the total numbers? Here’s the Bot Score for these cities: Berlin 2.3%, Hamburg 1.8% and Munich 1.2%. That’s one clear point for Munich.

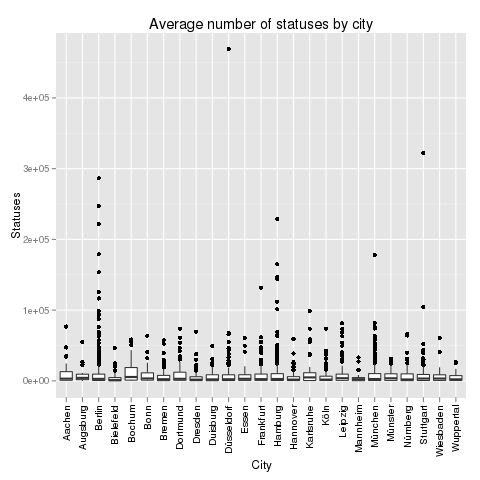
Finally, let’s take a look at Twitter statuses in these cities. Where do the most active Twitter users tweet from? Here’s a look at the full picture including outliers:

Average number of statuses by city

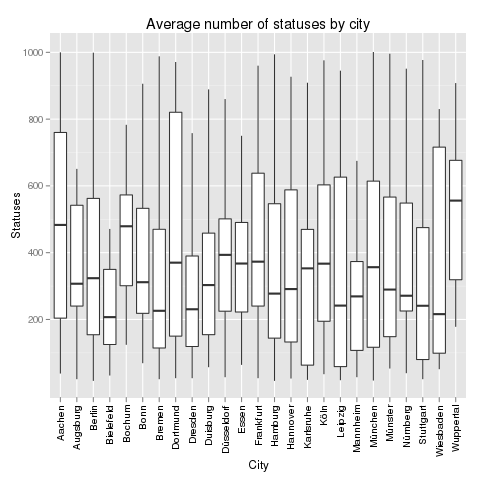
The city with the most active Twitter user surprisingly is not Bochum or Berlin, but Düsseldorf. And also Stuttgart seems to be very hot in this regard. But to really learn about activity, we have to remove the outliers again:

Average number of statuses by city

Without outliers, the most active Twitter cities in Germany are: Bochum (again!! 5514 statuses), Karlsruhe (4973) and Augsburg (4254). The Big 3 are in the midfield: Berlin (2845), Munich (2717) and Hamburg (2638).

Finally, there’s always the content. What are the users in the Big 3 cities talking about? The most frequently twittered words do not differ very much. In all three cities, “RT” is the most important word followed by a lot of words like “in”, “the” or “ich” that don’t tell much about the topics. It is much more interesting to look at word pairs (and especially at the pairs with the highest point wise mutual information (PMI). In Berlin, people are talking about “neues Buch” (new book – it’s a city of literature), “gangbang erotik” (hmm) and “nasdaq dow” (financial information seem to be important). In Munich, it’s “reise reisen” (Munich seems to love traveling), “design products” (very design oriented city) and “prost bier” (it’s a cliche, but it seems to be true). Compare this with Hamburg’s “amazon preis” (people looking for low prices), “social media” (Hamburg has a lot of online agencies) and “dvd blueray” (people watching a lot of TV).

Wrapping up, here are the final results:

          Berlin Munich Hamburg
Users          3      1       2
Followers      3      2       1
Friends        2      1       2
Bots          -3     -1      -2
Statuses       3      2       1
TOTAL          8      5       4

Congrats to Berlin!

[The R code that generated all the charts above can be found on my github.]

Social Network Analysis of the Twitter conversations at the WEF in Davos

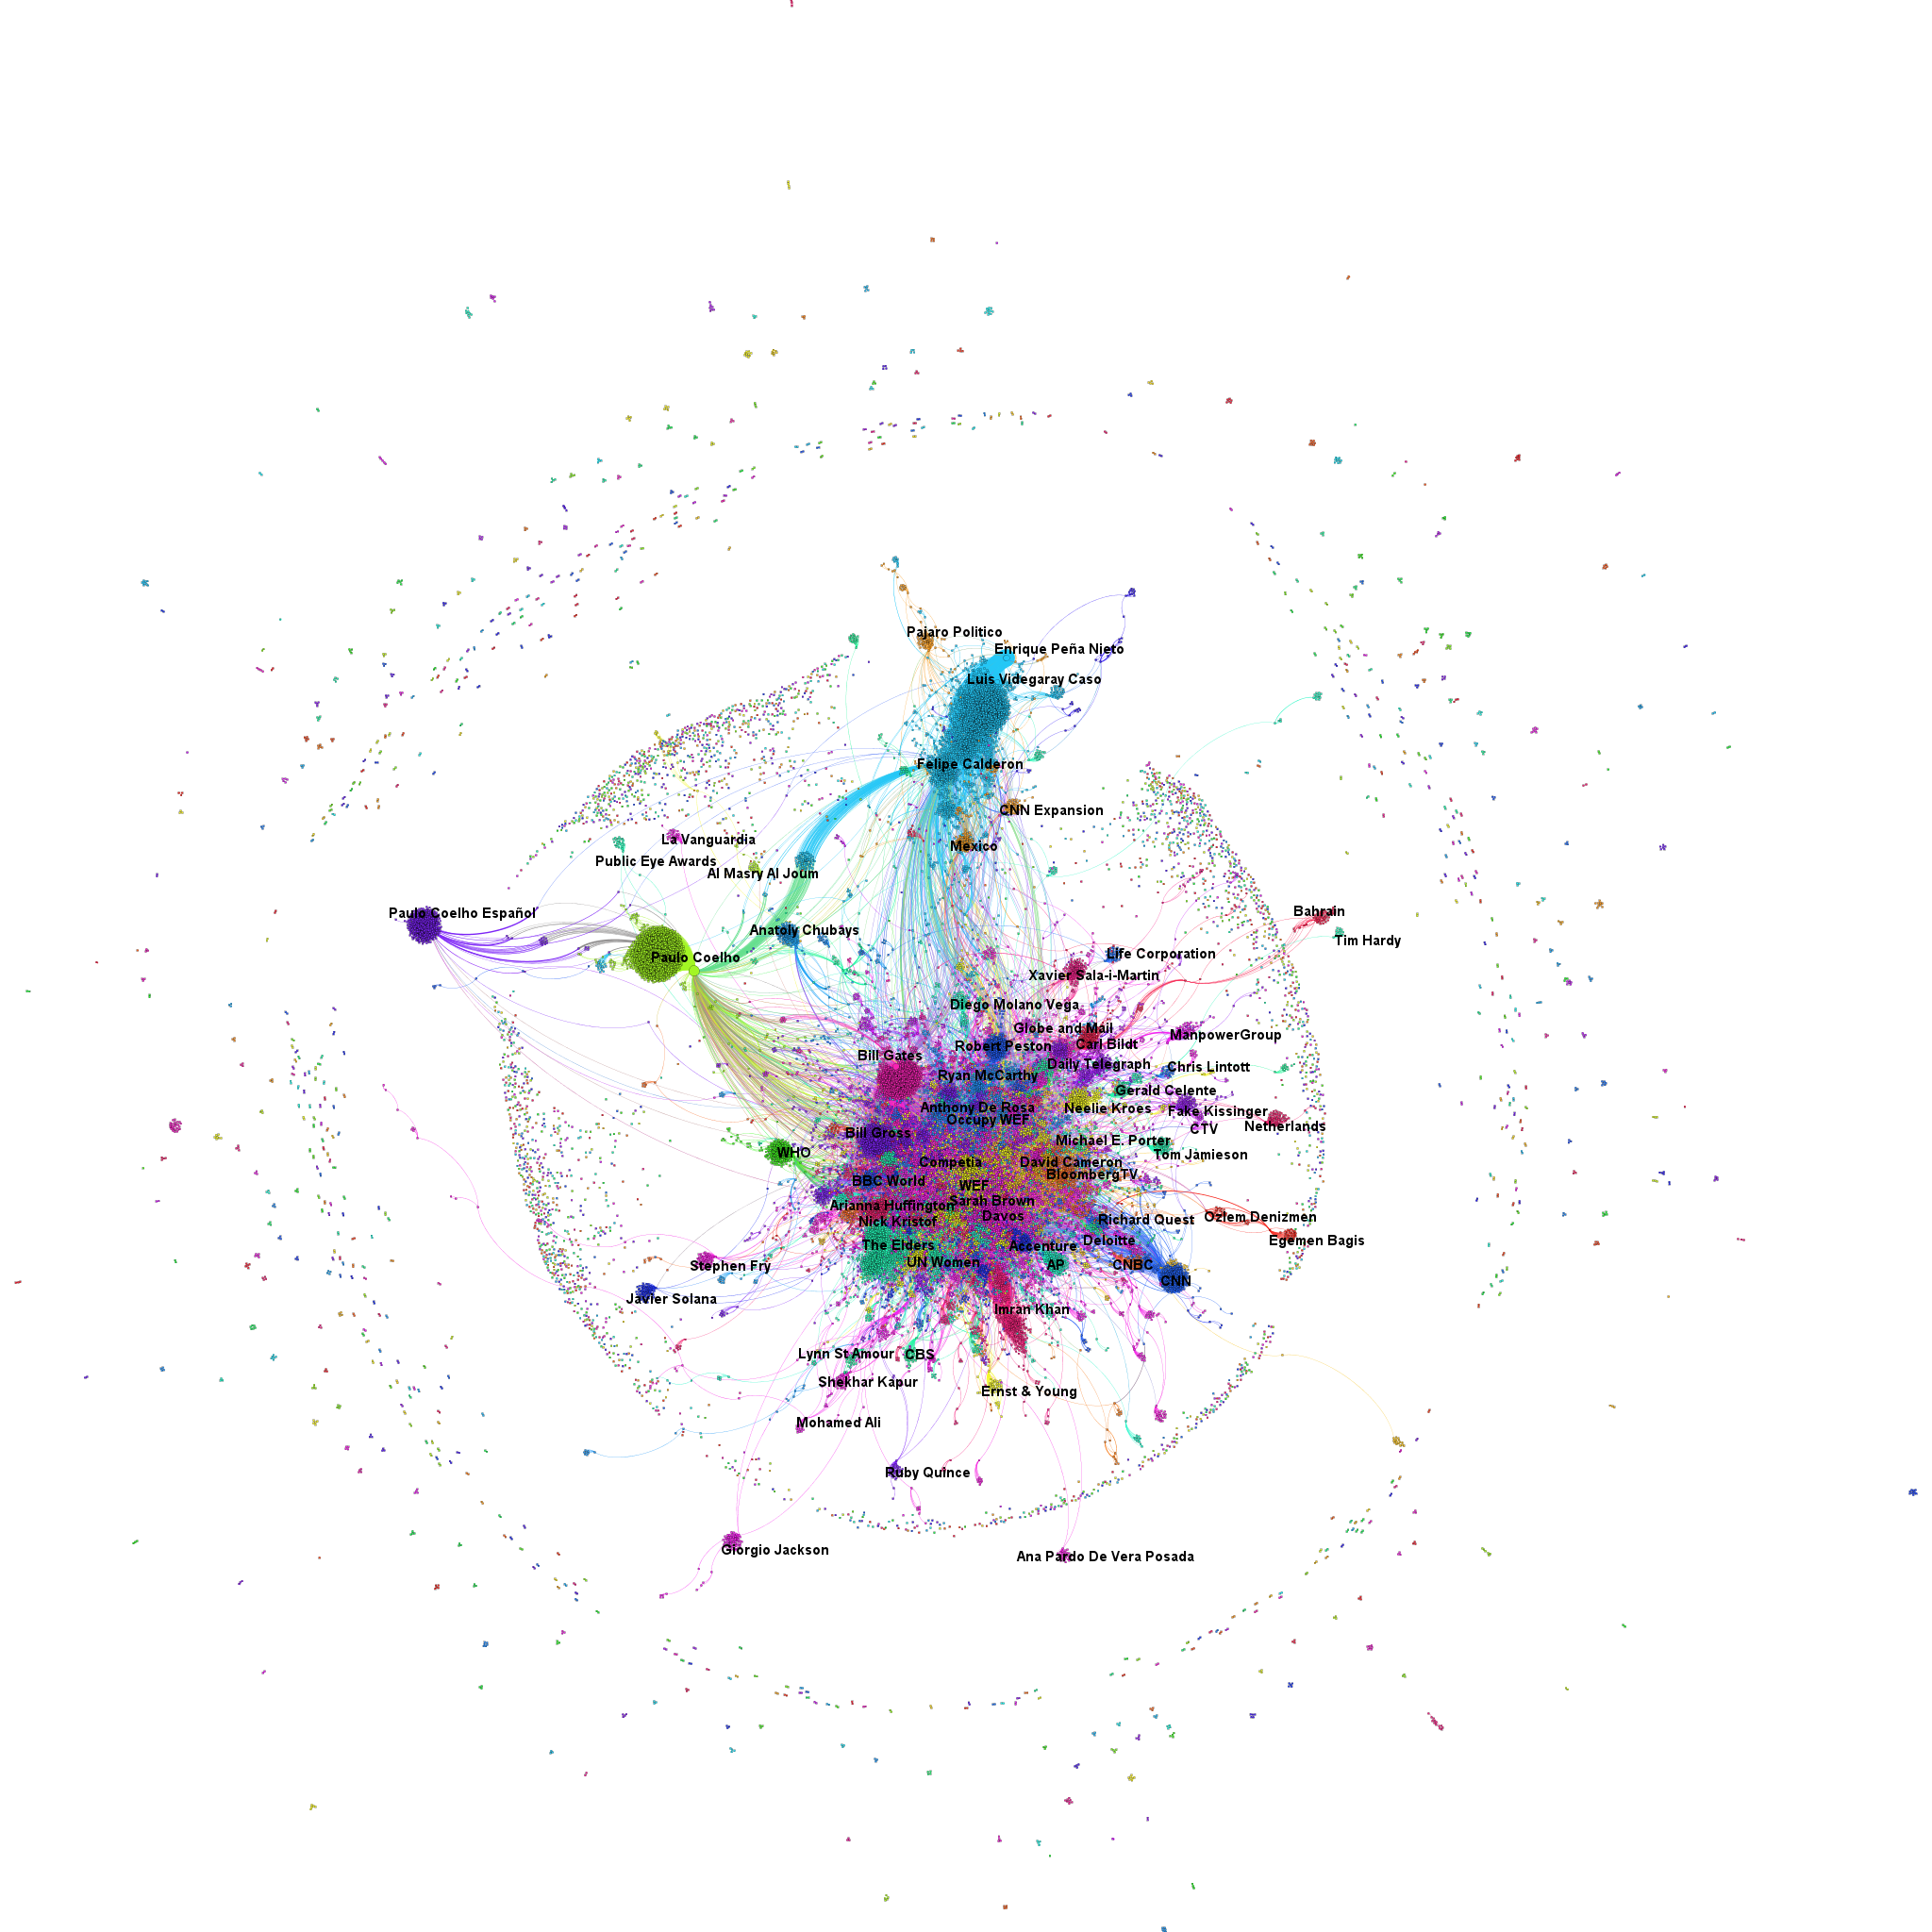
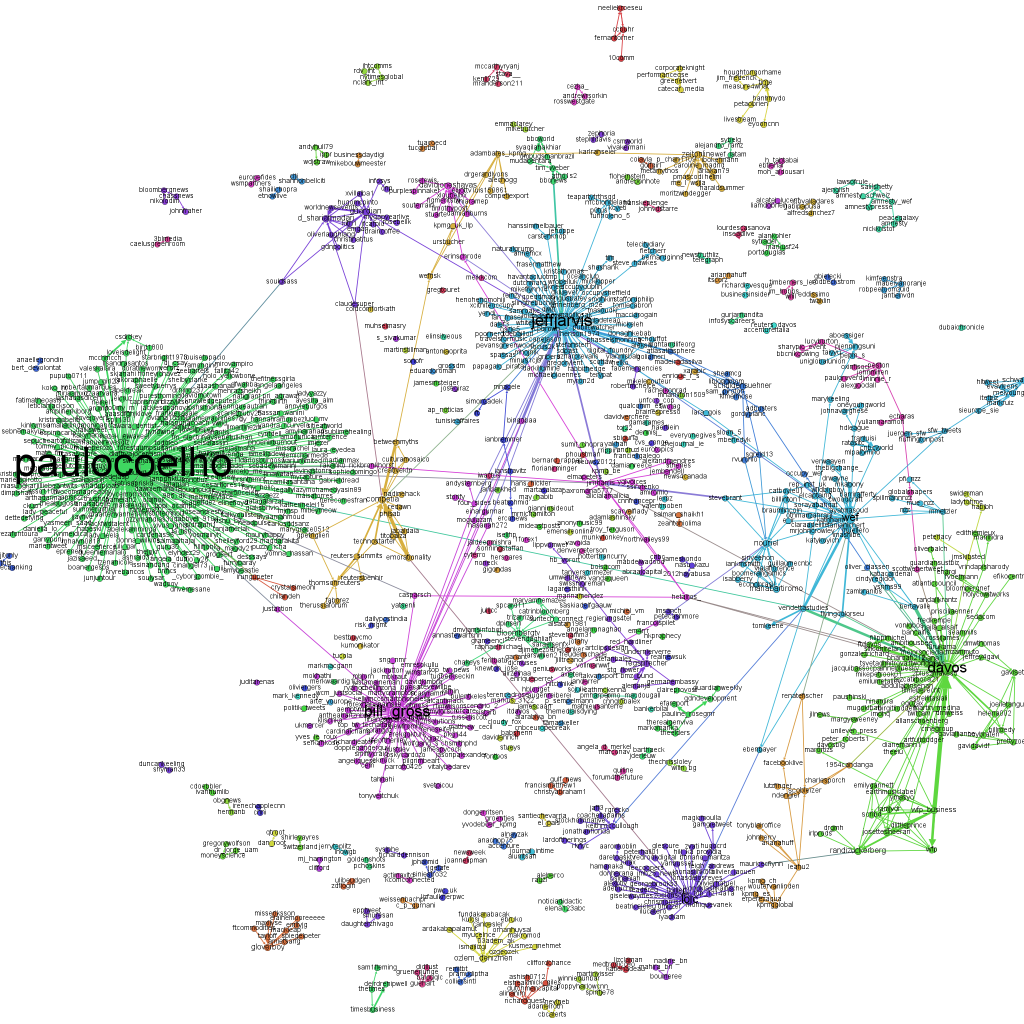
The minute, the World Economic Forum at Davos said farewell to about 2,500 participants from almost 100 countries, our network analytical machines switched into production mode. Here’s the first result: a network map of the Twitter conversations related to the hashtags “#WEF” and “#Davos”. While there are only 2,500 participants, there are almost 36,000 unique Twitter accounts in this global conversation about the World Economic Forum. Its digital footprint is larger than the actual event (click on map to enlarge).

There are three different elements to note in this visualization: the dots are Twitter accounts. As soon as somebody used one of the two Davosian hashtags, he became part of our data set. The size of the notes relates to its influence within the network – the betweenness centrality. The better nodes are connecting other nodes, the more influential they are and the larger they are drawn. The lines are mentions or retweets between two or more Twitter accounts. And finally, the color refers to the subnetworks or clusters generated by replying or retweeting some users more often than others. In this infographic, I have labelled the clusters with the name of the node that is in the center of this cluster.

DLD Conference – what were Twitter users discussing?

While I was taking a look at the network dynamics and relations of the Twitter conversations at the DLD conference in Munich, Salesforce and Radian6 took a more “traditional” approach and segmented the conversations in terms of topics, users and countries. While a tag cloud is able to give a first impression on the relevant content of the discussions, a semantic analysis goes much deeper and shows the relations between the terms used by the conference attendants. Here’s a look at the most important and most frequently connected words related to the Twitter hashtags “#DLD12” and “#DLD”:

The most frequently used words and related concepts have been the following:

See also: Networking at the DLD conference part 1 and part 2

Networking at Davos – 1st day

Now, that the World Economic Forum at Davos has started, also the conversational buzz on Twitter is increasing. While yesterday news agencies and journalists dominated the buzz, this morning (data ranging from 10:15 to 11:40) clearly has been a Paulo Coelho moment. The following tweet has been the most frequently retweeted #WEF tweet:

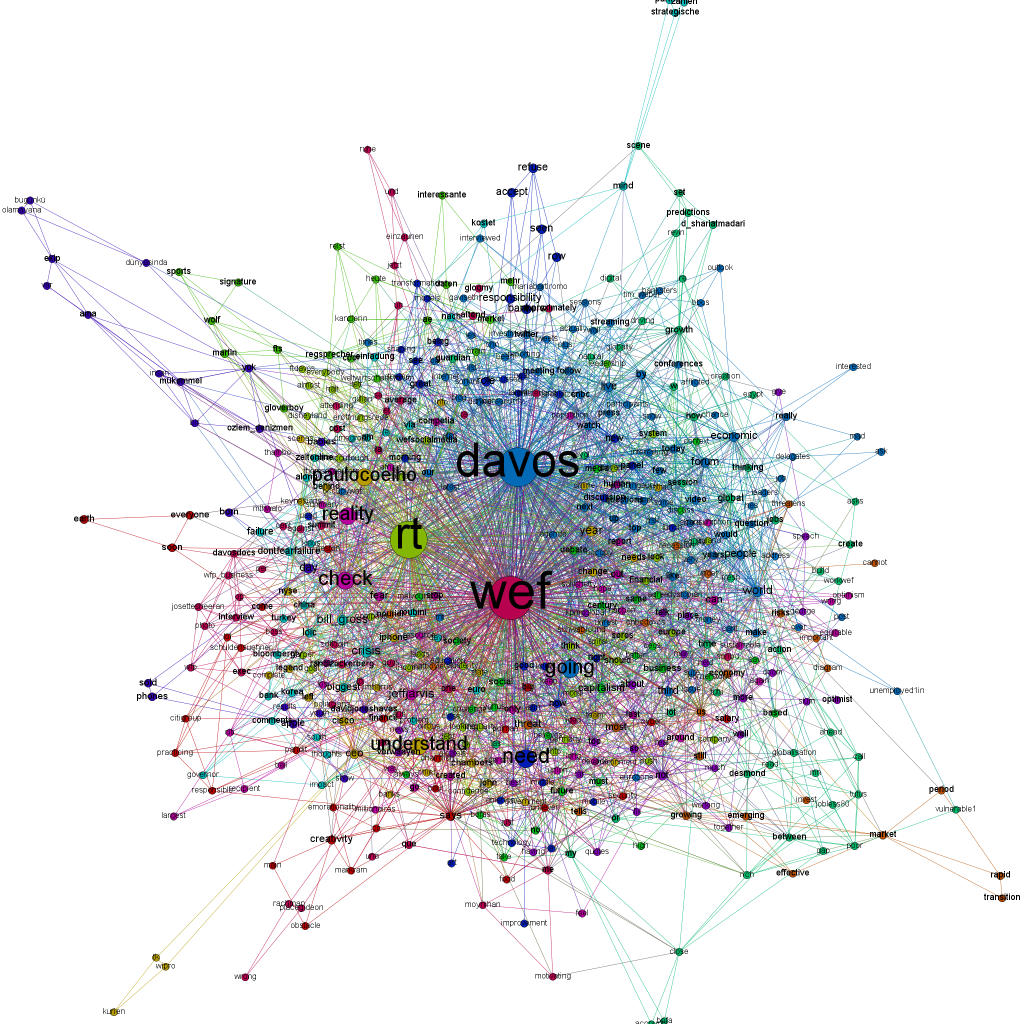
The most mentioned accounts in this time frame have been the following: @paulocoelho (265 mentions and retweets), @jeffjarvis (81), @bill_gross (74), @davos (63) and @loic (39). Interestingly, these five most frequently mentioned accounts did not contribute much to the Davos related Twitter conversations: Paulo Coelho mentioned #WEF in a tweet that has been resounding in the analyzed time frame and Jeff Jarvis did post three tweets. Here’s a visualization of the Twitter users mentioning each other. The larger a node, the more often it has been mentioned by other users.

If we take a look at the content, the most frequently mentioned words have been: wef (1001 times), davos (886), rt (= retweet, 827), need (301 times) and going (281 times). The last two words are clearly related to Paulo Coelhos tweet mentioned above. Other interesting words that have been connected to WEF and Davos are: crisis (89 times), world (88), bankers (61), responsibility (57), people (55), refuse (55), CEO (51) and fear (49):