Anomaly Detection with Wikipedia Page View Data

Today, the Twitter engineering team released another very interesting Open Source R package for working with time series data: “AnomalyDetection“. This package uses the Seasonal Hybrid ESD (S-H-ESD) algorithm to identify local anomalies (= variations inside seasonal patterns) and global anomalies (= variations that cannot be explained with seasonal patterns).

As a kind of warm up and practical exploration of the new package, here’s a short example on how to download Wikipedia PageView statistics and mine them for anomalies (inspired by this blog post, where this package wasn’t available yet):

First, we install and load the necessary packages:

library(RJSONIO)
library(RCurl)
library(ggplot2)
install.packages("devtools")
devtools::install_github("twitter/AnomalyDetection")
library(AnomalyDetection)

Then we choose an interesting Wikipedia page and download the last 90 days of PageView statistics:

page <- "USA"
raw_data <- getURL(paste("http://stats.grok.se/json/en/latest90/", page, sep=""))
data <- fromJSON(raw_data)
views <- data.frame(timestamp=paste(names(data$daily_views), " 12:00:00", sep=""), stringsAsFactors=F)
views$count <- data$daily_views
views$timestamp <- as.POSIXlt(views$timestamp) # Transform to POSIX datetime
views <- views[order(views$timestamp),]

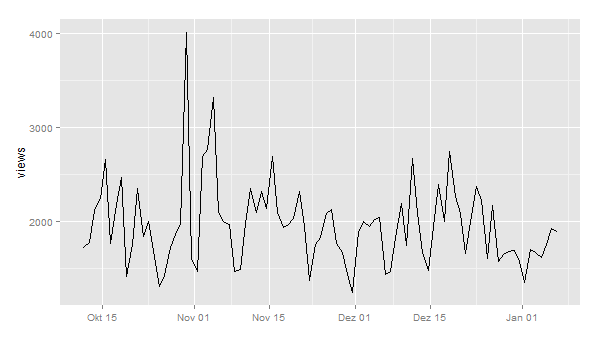
I also did some pre-processing and transformation of the dates in POSIX datetime format. A first plot shows this pattern:

ggplot(views, aes(timestamp, count)) + geom_line() + scale_x_datetime() + xlab("") + ylab("views")
wikipedia_views_USA

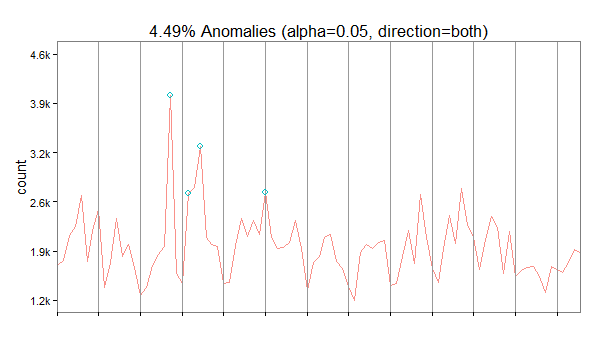
Now, let’s look for anomalies. The usual way would be to feed a dataframe with a date-time and a value column into the AnomalyDetection function AnomalyDetectionTs(). But in this case, this doesn’t work because our data is much too coarse. It doesn’t seem to work with data on days. So, we use the more generic function AnomalyDetectionVec() that just needs the values and some definition of a period. In this case, the period is 7 (= 7 days for one week):

res = AnomalyDetectionVec(views$count, max_anoms=0.05, direction='both', plot=TRUE, period=7)
res$plot
wikipedia_anomalies_usa

In our case, the algorithm has discovered 4 anomalies. The first on October 30 2014 being an exceptionally high value overall, the second is a very high Sunday, the third a high value overall and the forth a high Saturday (normally, this day is also quite weak).

Algorithmic Glass Bead Games – Why predicting Twitter trends will not change the world

The last hours, I’ve seen a lot of tweets mentioning this great new algorithm by MIT professor Devavrat Shah. The UK Wired, The Verge, Gigaom, The Atlantic Wire and Forbes all posted stories on this fantastic discovery. And this has only been the weekend. Starting next week, there will be a lot more articles celebrating this breakthrough in machine learning.

At first, I was very enthusiastic as well and tweeted the MIT press release. A new algorithm – great stuff! But then slowly, I began to think about this whole thing. This new algorithm claims to predict trending topics on Twitter. But this is a lot different from an algorithm predicting e.g. the outcome of presidential elections or other external events. Trending topics are nothing more than the result of an algorithm themselves:

Trends are determined by an algorithm and are tailored for you based on who you follow and your location. This algorithm identifies topics that are immediately popular, rather than topics that have been popular for a while or on a daily basis, to help you discover the hottest emerging topics of discussion on Twitter that matter most to you.

So, what Shah et al developed is an algorithm that is predicting the outcome of an algorithm. A lot of the coverage suggests that this new algorithm could be very useful for Twitter – because then they would not have to wait for the results of their own algorithm that is defining trends but could use the much brand new algorithm that gives the results 1.5 hours in advance:

The algorithm could be of great interest to Twitter, which could charge a premium for ads linked to popular topics.

What’s next? A Stanford professor that develops an algorithm that can predict the outcome of the Shah algorithm some 1.5 hours in advance? Or what about Google? Maybe someone will invent an algorithm predicting the PageRank for web pages? Oh, wait, something like this has already been invented. Maybe you’ll better know this under its acronym “SEO” or “Search Engine Optimization”.

DLD Conference – what were Twitter users discussing?

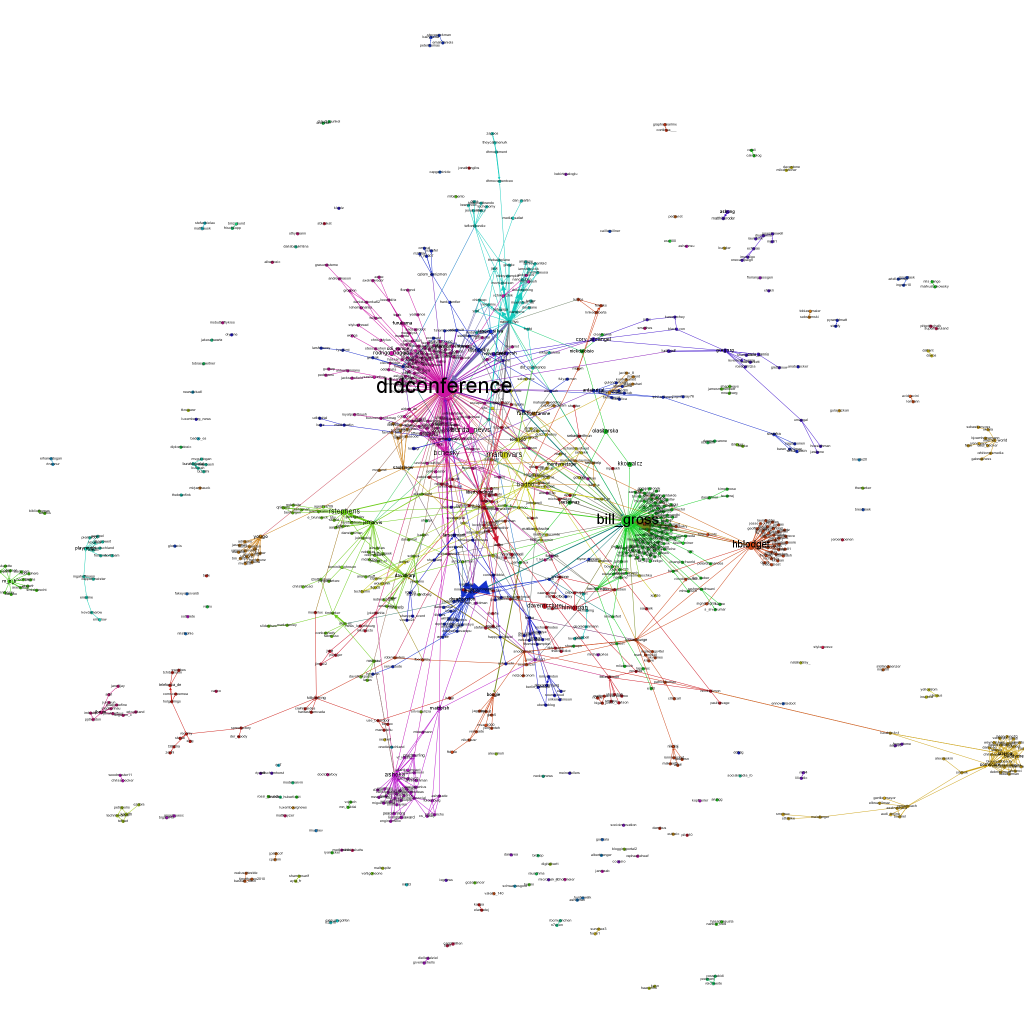
While I was taking a look at the network dynamics and relations of the Twitter conversations at the DLD conference in Munich, Salesforce and Radian6 took a more “traditional” approach and segmented the conversations in terms of topics, users and countries. While a tag cloud is able to give a first impression on the relevant content of the discussions, a semantic analysis goes much deeper and shows the relations between the terms used by the conference attendants. Here’s a look at the most important and most frequently connected words related to the Twitter hashtags “#DLD12” and “#DLD”:

The most frequently used words and related concepts have been the following:

See also: Networking at the DLD conference part 1 and part 2

Networking at the DLD conference (Part II)

As promised, here’s the second part of the DLD conference network analysis. We left the conference Monday afternoon. The remaining day looked like this:

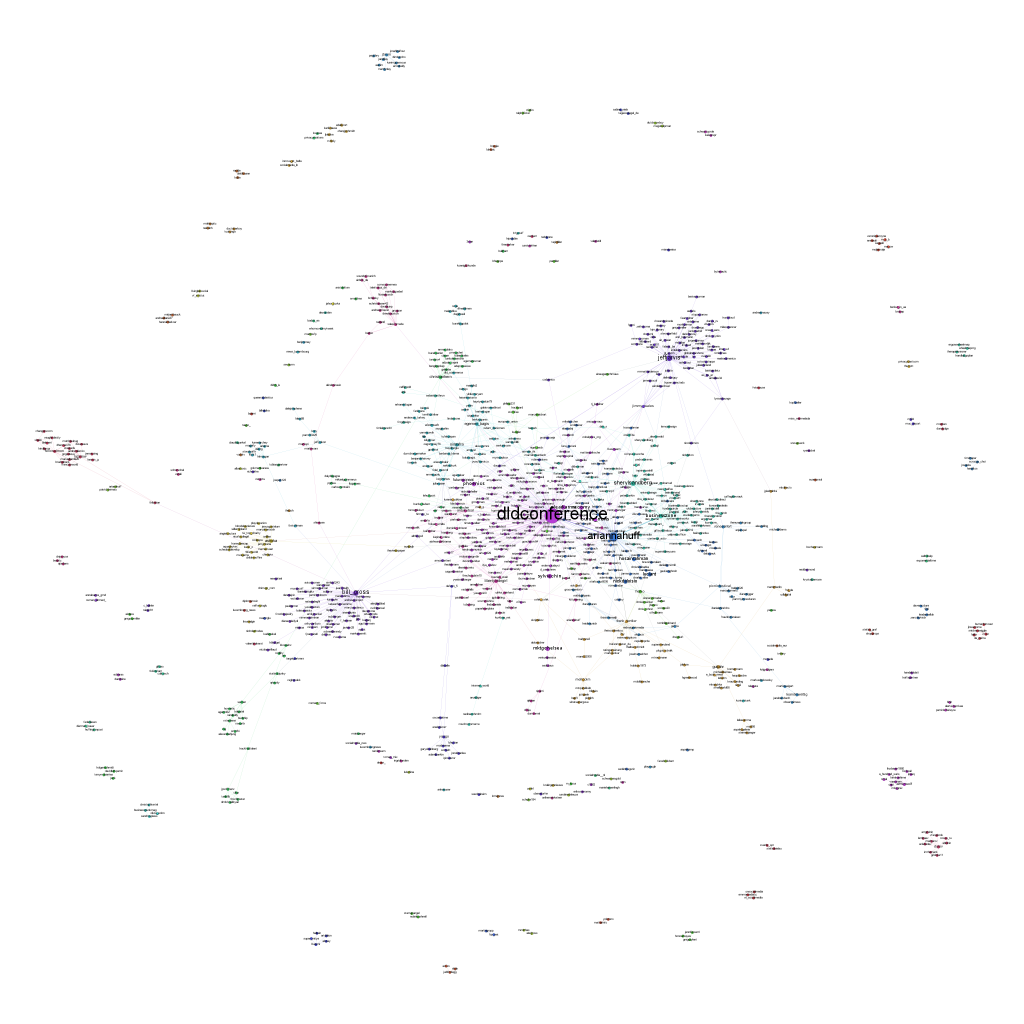
The conference account @DLDConference and Idealab founder @Bill_Gross still are the most important Twitter discussions nodes in terms of PageRank. But there are also some new names and clusters in this map, for example enterpreneur Martin Varsawsky (@martinvars), the NGO @ashoka and BestBuy CTO @rstephens. On Tuesday, it looks quite different. This clearly has been Jeff Jarvis’ day. Not only did he take Bill Gross’ place but also overtook the official DLD conference account. But he hasn’t been the only new influencer today: Wikipedia’s Jimmy Wales, Huffington Post’s Arianna Huffington and Facebook’s COO Sheryl Sandberg also were important nodes in the DLD Twitter conversational network.

Here’s the map for the final DLD day:

Visually spoken: The conference is starting to dissolve. And people are moving on to Davos and getting ready for the World Economic Forum there.

Networking at Davos – getting ready for the WEF [updated]

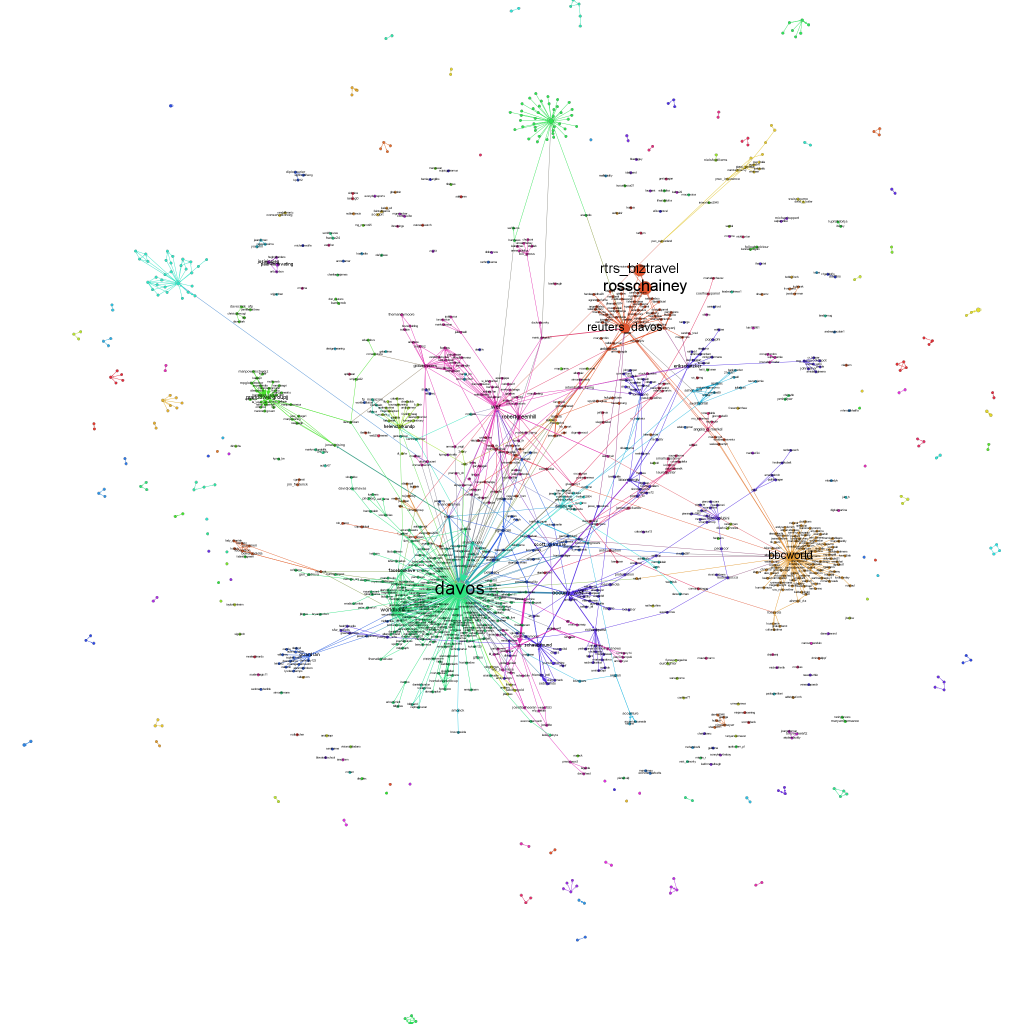
The same thing that can be done for the DLD conference in Munich can of course be done for the WEF in Davos. This gives us a good opportunity to compare pre-conference and conference buzz of the two gatherings and compare actors, topics and network structures. Here’s a first glance at the Twitter conversation network for the hashtags #WEF and #Davos (recorded from Mon 7:15 pm to Tue 11:30 am):

One thing is very obvious from this structure: The WEF is much more of a news media event than the DLD (see the visualization of the DLD network from the day before the event). There are two very densely populated clusters of journalists from Reuters (red in the top right of the map) dominated by @rtrs_biztravel, @reuters_davos and journalist @reuters_davos and another BBC cluster (light brown on the right) dominated by @bbcworld. And there is also the guardian (deep blue on the bottom left) Other actors that have influential network positions are @worldbank and (this could become interesting) @occupy_wef. All in all the buzz generated by #WEF and #Davos appears to be significantly larger than the DLD related buzz.

Most frequently mentioned are: @davos (222 mentions), @bbcworld (94), @worldbank (58), @reuters_davos (49) and @wef (44). Most active users are Bloomberg’s @tomkeene (16 Davos tweets), @loupo85 (10), journalist Ken Graggs @betweenmyths (8), Reuters Social Media editor @antderosa (7) and Schwab Foundation @schwabfound (7).

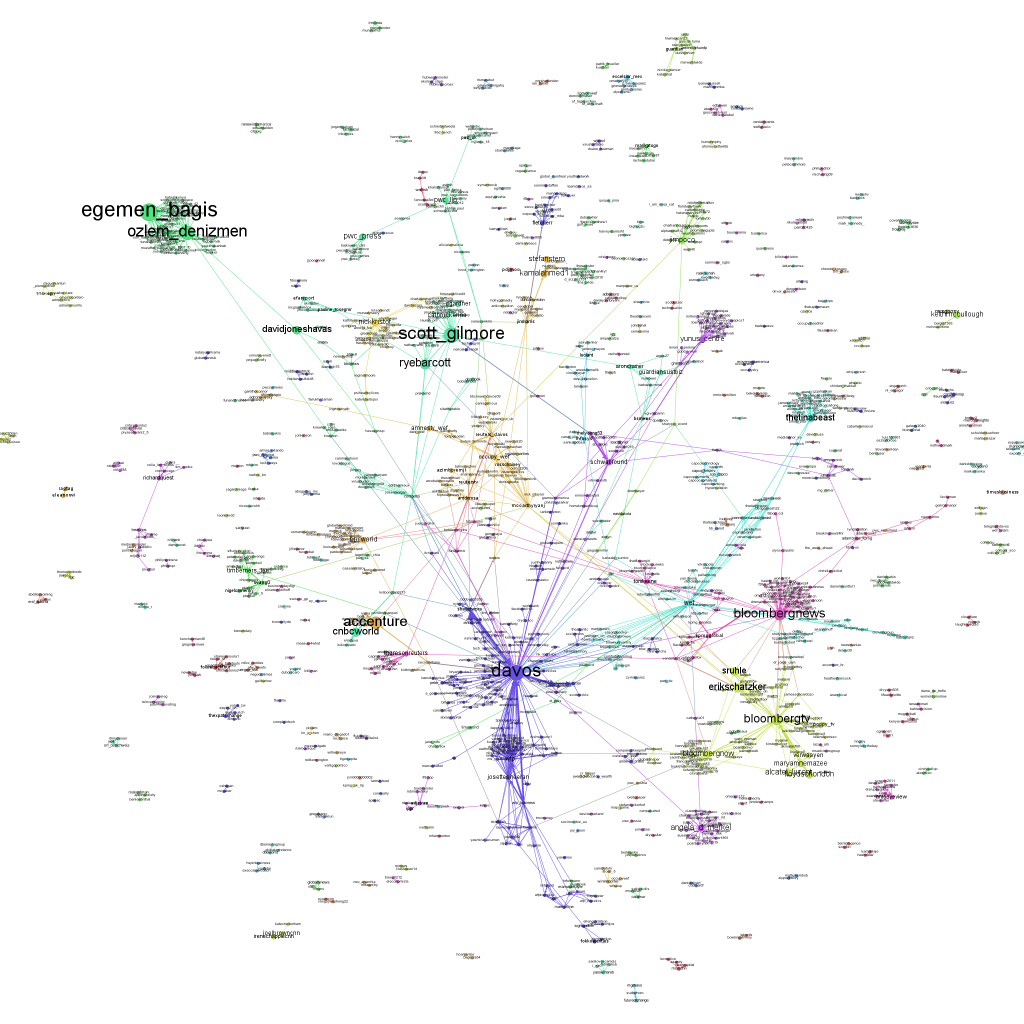
UPDATE: And here is the first update to the network graphic. The data is now covering Tue 11:30 am to Tue 6:15 pm. That’s 1,600 tweets within 6.75 hours. So, the pace is clearly accelerating. For the first WEF analysis, we analysed 1,600 tweets within 16.25 hours. Now let’s take a look at the resulting network diagram:

Now, the Reuters and BBC clusters that dominated the Twitter discussions in the morning, have somewhat dissolved. Instead, there are new clusters centering on Bloomberg (light green and pink on the right), Angela D. Merkel (violet bottom right) – which by the way is not the official account of the German chancellor -, Yunus centre (violet at the top), Scott Gilmore (green at the top) and a very dense minicluster of Turkish EU affairs minister Egemen Bagis and Ozlem Denizmen (green at the top left). So it’s definitely starting to get more political 😉 The Occupy WEF cluster has been joined (structurally) by Amnesty WEF and has been connected (or interwoven) to the former Reuters cluster.

Here’s a list of the most frequently mentioned Twitter accounts in conversations with the hashtags “#WEF’ or ‘#Davos’: @davos (109 mentions), @ozlem_denizmen (45), @bloombergnews (43), @egemen_bagis (39) and @wef (36). The most active conversationalists are: @competia (12 posts), @antderosa (11), @mccarthyryanj (9), @wfp_business (9) and @sachailichopra (9).