Why the 2012 US elections are more exciting than 2008

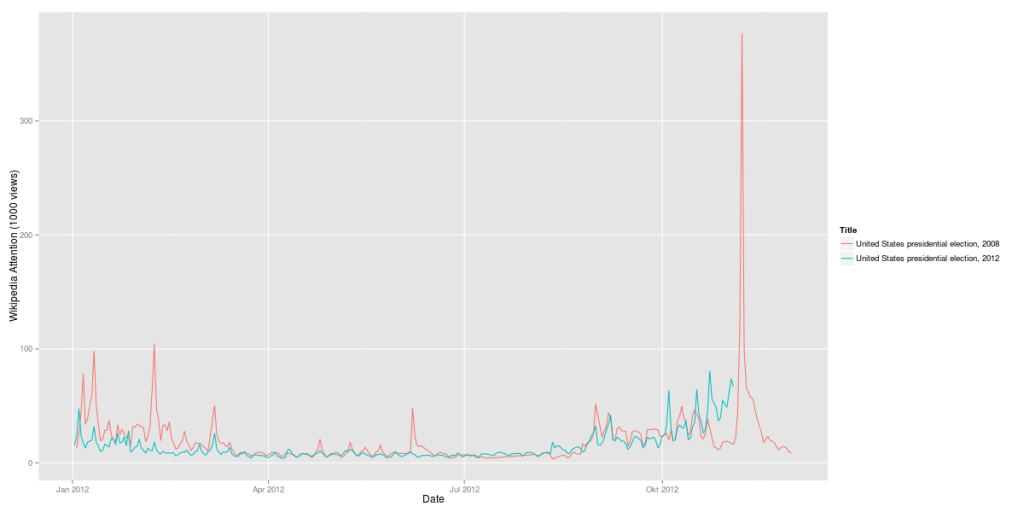
Here’s an addition to my last post on using Wikipedia data to analyse attention for the US presidential elections 2012. Here’s another look at the interest not for the candidates’ Wikipedia pages but the general pages for the elections 2008 and 2012. Compared to the candidates’ pages, the attention for the general election page is much lower than for the candidates. Here’s the average values for October 2012:

  1. Mitt Romney (2012): 98,138 Views / day
  2. Barack Obama (2012): 63,104 Views / day
  3. United States presidential election, 2012 (2012): 38,770
  4. United States presidential election, 2008 (2008): 27,907

This monthly average hints at the 2012 elections being very exciting as the general election pages on Wikipedia have seen a 39% traffic increase compared to last elections. This also hold for the following time-series:

US Presidential Elections 2012 vs. 2008 (Wikipedia, daily visits)

While the attention for the election pages in 2012 did not reach the level it had during the 2008 primaries, from mid October the 2012 campaigns were much more interesting according to the Wikipedia numbers. In 2008 we have seen a drop in attention before election day, in 2012 the suspense seems to build up.

Algorithmic Glass Bead Games – Why predicting Twitter trends will not change the world

The last hours, I’ve seen a lot of tweets mentioning this great new algorithm by MIT professor Devavrat Shah. The UK Wired, The Verge, Gigaom, The Atlantic Wire and Forbes all posted stories on this fantastic discovery. And this has only been the weekend. Starting next week, there will be a lot more articles celebrating this breakthrough in machine learning.

At first, I was very enthusiastic as well and tweeted the MIT press release. A new algorithm – great stuff! But then slowly, I began to think about this whole thing. This new algorithm claims to predict trending topics on Twitter. But this is a lot different from an algorithm predicting e.g. the outcome of presidential elections or other external events. Trending topics are nothing more than the result of an algorithm themselves:

Trends are determined by an algorithm and are tailored for you based on who you follow and your location. This algorithm identifies topics that are immediately popular, rather than topics that have been popular for a while or on a daily basis, to help you discover the hottest emerging topics of discussion on Twitter that matter most to you.

So, what Shah et al developed is an algorithm that is predicting the outcome of an algorithm. A lot of the coverage suggests that this new algorithm could be very useful for Twitter – because then they would not have to wait for the results of their own algorithm that is defining trends but could use the much brand new algorithm that gives the results 1.5 hours in advance:

The algorithm could be of great interest to Twitter, which could charge a premium for ads linked to popular topics.

What’s next? A Stanford professor that develops an algorithm that can predict the outcome of the Shah algorithm some 1.5 hours in advance? Or what about Google? Maybe someone will invent an algorithm predicting the PageRank for web pages? Oh, wait, something like this has already been invented. Maybe you’ll better know this under its acronym “SEO” or “Search Engine Optimization”.

Wikipedia Attention and the US elections

One of the most interesting challenges of data science are predictions for important events such as national elections. With all those data streams of billions of posts, comments, likes, clicks etc. there should be a way to identify the most important correlations to make predictions about real-world behavior such as: going to the voting booth and chosing a candidate.

A very interesting data source in this respect is the Wikipedia. Why? Because Wikipedia is

  1. a) open (data on page-views, edits, discussions are freely available on daily or even hourly basis),
  2. b) huge (WP currently ranks as #6 of all web sites worldwide and reaches about a quarter of all online users),
  3. c) specific (people visit the Wikipedia because they want to know something about some topic)

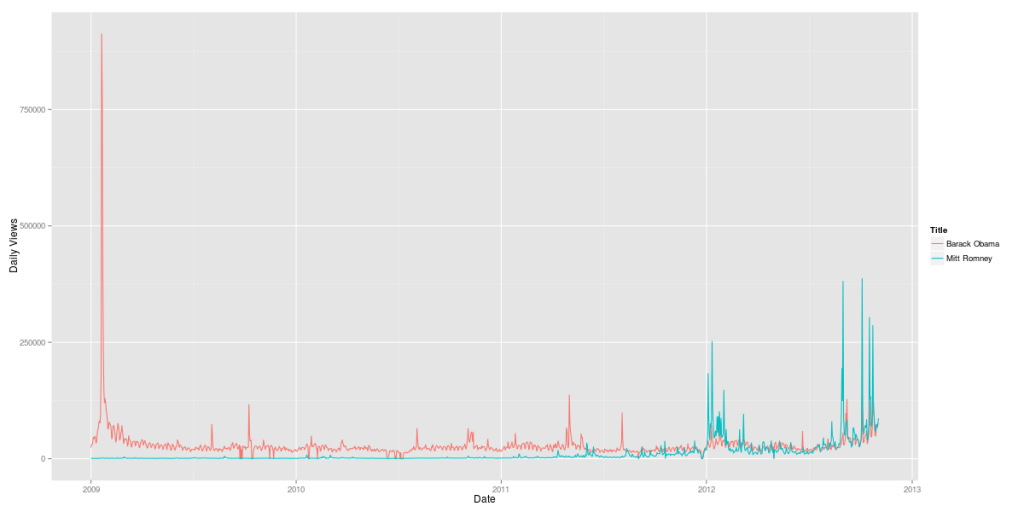
The first step was comparing the candidates Barack Obama and Mitt Romney over time. The resulting graph clearly shows the pivoting points of Obama’s presidential career (click to zoom):

Obama vs. Romney 2009-2012 (Wikipedia data)

But it also shows how strong Mitt Romney has been since the Republican primaries in January 2012. His Wikipedia page had attracted a lot more visitors in August and September 2012 than his presidential rival’s. Of course, this measure only shows attention, not sentiment. So it cannot be inferred from this data whether the peaks were positive or negative peaks. In terms of Wikipedia attention, Romney’s infamous 47% comments in September 2012 were more than 1/3 as important as Obama’s inauguration in January 2009.

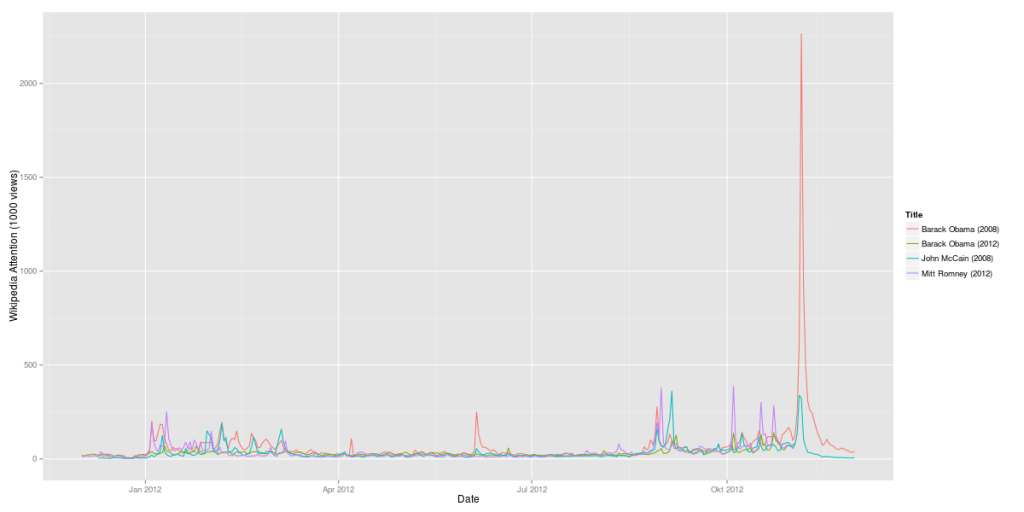
Now, let’s add some further curves to this graph: Obama’s and McCain’s Wikipedia attention during the last elections:

Obama vs. Romney 2012 compared to Obama vs. McCain 2008 (Wikipedia data)

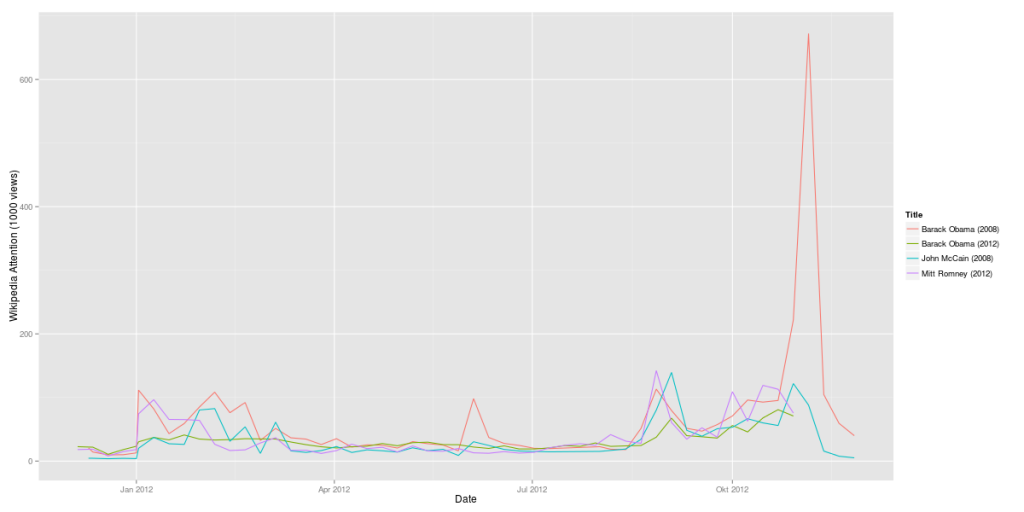
Here’s another version with weekly data:

Obama vs. Romney 2012 compared to Obama vs. McCain 2008 (Wikipedia data, weeks)

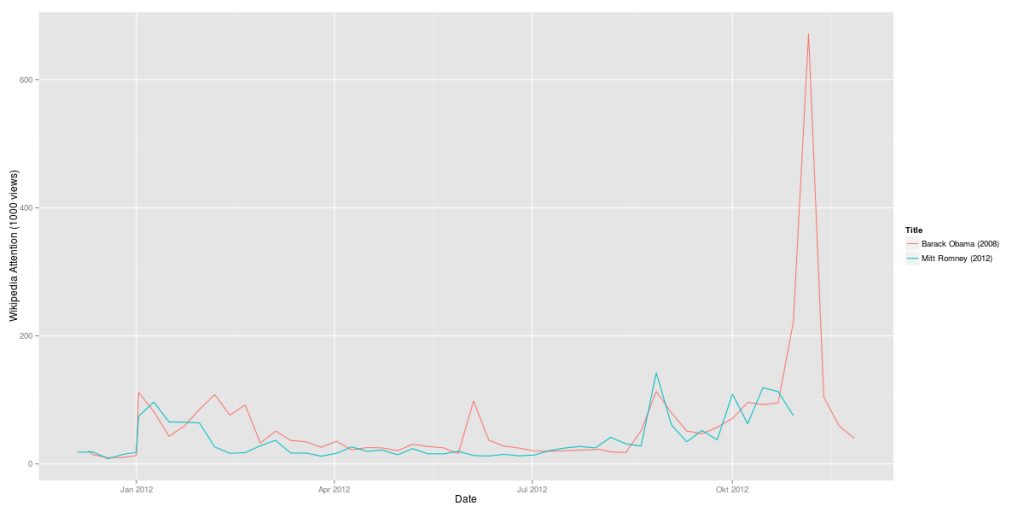
It’s almost instantly clear how much more attention Obama’s 2008 campaign (in red) gathered in comparison with his 2012 campaign (in green). On the other hand, Mitt Romney is at least when it comes to Wikipedia attention more interesting than McCain had been.

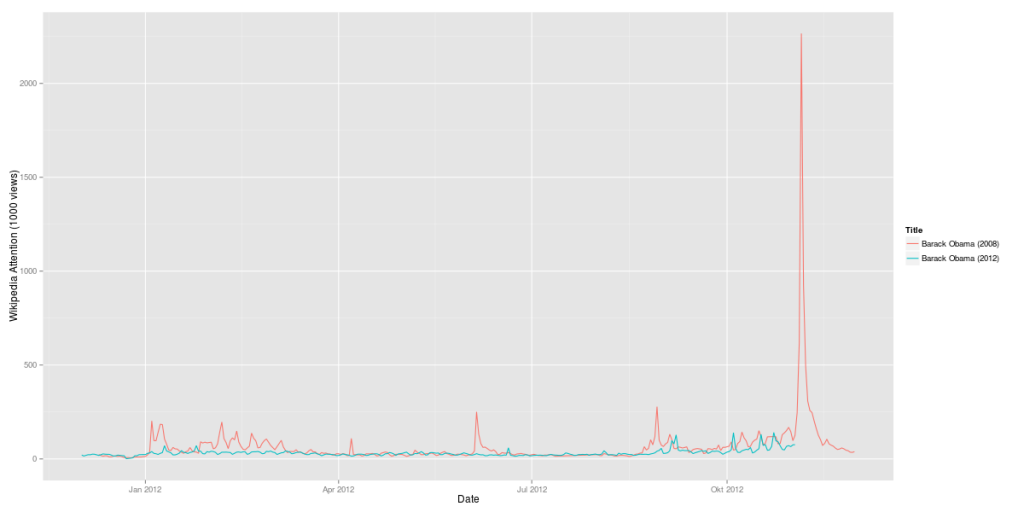
Here’s a comparison of Obama’s 2008 campaign vs. his 2012 campaign:

Obama 2008 vs. Obama 2012 (Wikipedia data)

The last question: Is Mitt Romney 2012 as strong as Obama had been in 2008? Here’s a direct comparison:

Obama 2008 vs. Romney 2012 (Wikipedia data, weekly)

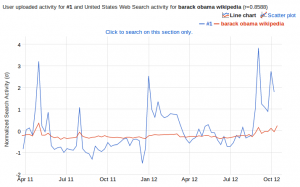
A side-remark: I also did a correlation of this data set with Google Correlate. And guess what: The strongest correlation of the data for Obama’s 2012 campaign is the Google search query for “barack obama wikipedia”. There still seem to be a huge number of people using Google as their Wikipedia search-engine.

Google Correlate result for the Wikipedia time series "Barack Obama"
Google Correlate result for the Wikipedia time series “Barack Obama”

But this result could also be interpreted the other way round: If there is a strong correlation between Wikipedia usage and Google search queries, this makes Wikipedia an even more important data source for analyses.

3,4,5 … just how many Vs are there?

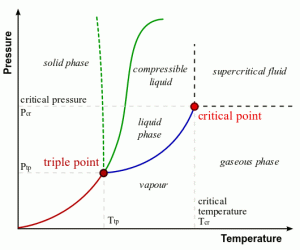
Aggretates - Solid, Liquid, Vapour.
I am confident, that BigData will harden into a solid and not get vapourised. Perhaps someday, it will reach the critical temperature and just get transparent – like so many other disrupting developments.
(Fig. CC BY-SA 3.0 by Matthieumarechal)
It took a while for the three Vs of Big data to take off as one of the most frequently quoted buzzwords of BigData. Doug Laney of Meta Group (now aquired by Gartner) had coined the in his paper on “3-D Data Management: Controlling Data Volume, Velocity and Variety” in 2001. But now, with everybody in the industry philosophing on how to characterize BigData, it is now wonder, that we start seeing many mutations in the viral spreading of Leney’s catchy definition.

Be it veracity, or volatility, or no Vs at all, many aspects of BigData are now transformed metaphorically into terms with V.

Lets just hope, nobody comes along with too much vapour that makes the bubble burst before it became mature enough. But I am confident 😉

wind map – truly beautiful data!

(blow friend to fiend: blow space to time)
—when skies are hanged and oceans drowned,
the single secret will still be man

e. e. cummings, what if a much of a which of a wind

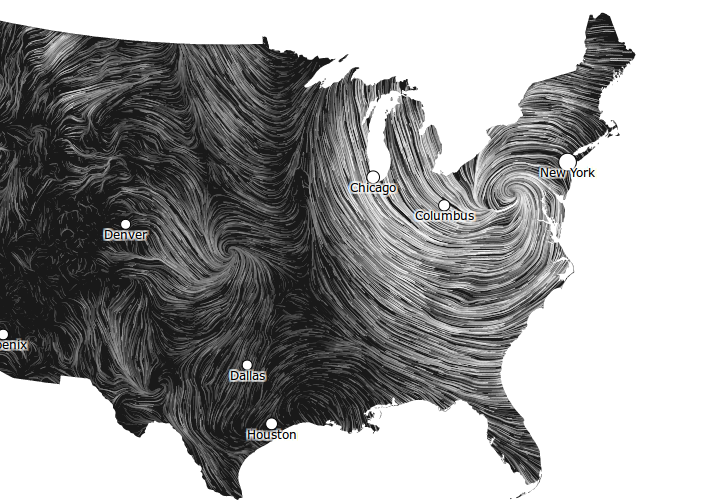
Open data is great. The National Digital Forecast Database offers free access to all the weather forecast data of the US National Weather Service. All of the US is covered with the predicted values for variables that influence the weather, like cloud cover, temperature, wind speed and direction.

Fernanda Viégas and Martin Wattenberg, two artists from Cambridge, Ma. have turned the wind forecast into a beautiful visualization. On their remarkable site http://hint.fm there are many fantastic data-viz projects, like the Flickr Flow, that give the best examples, what treasures are to be excavated from open data sources.

Not just because of hurrican Sandy, the Wind Map is one of the best cases they have on display. This is beautiful data!

10 Petabytes of Culture at Archive.org

Archive.org celebrated their crossing the mark of 10 Petabytes data stored.[1] The non-profit organisation based in San Francisco, has been following its mission to archive the Internet and provide universal access to all knowledge since 1996.

The number of 1016 might look impressive (and if we remember typical server storage capacity 10 years ago it still is, to be honest) – however the daily amount of data processed by Google alone would be exceeding more than double of that – not speaking of several hundred Petabytes of images and video stored by Facebook and Youtube. So while the achievments of Archive.org in preservation of culture are unvaluable, the task of keeping track of the daily data deluge seams out of reach, at least for the time being. To cope with mankind’s data heritage will for sure become a fascinating challenge for bigdata.

Big Data journal launches in 2013

A very clear indicator that a topic is not only an ephemeral hype is when there will be a scientific journal for this new topic. This has just happened with Big Data as Liebert publishers just announced at the Strata conference the launch of their peer-reviewed journal “Big Data” for 2013. It will be edited by O’Reilly’s Edd Dumbill.

But you don’t have to wait until the next year, but can already grab a special preview issue featuring five original articles for download right now.

All peer-reviewed articles will be published under a Creative Commons licence and therefore be available for free when they will be published.

TechAmerica publishes “Big Data – A practical guide to transforming the business of government”

Earlier this month, the TechAmerica foundation has published their comprehensive reader “Demystifying Big Data: A Practical Guide To Transforming The Business of Government”.

Lobbying politicians to follow the Big Data path and support the industry by issuing the necessary changes in education and research infrastructure is a just and also obvious goal of the text. Nevertheless, the publication offers quite some interesting information on Big Data in general and its application in the pubic sector in particular.

It is also a good introduction into the field. Defining not only the notorious “Three Vs” volume, velocity, variety that we are used to characterize Big Data with, but adding a forth V: Veracity – the quality and provenance of received data. Because of the great progress in error and fraud detection, outlier handling, sensitivity analysis, etc. we tend to neglect the fact, that still data-based decisions require traceability and justification – with those huge heaps of data very well more then ever.

To encourace every federal agency “to follow the FCC’s decision to name a Chief Data Officer” is one of the sensible conclusions of the text.

How content is propagated might tell what it’s about

Memes – images, jokes, content snippets that get spread virally on the net – have been a popular topic in the Net’s pop culture for some time. A year ago, we started thinking about, how we could operationalise the Meme-concept and detect memetic content. Thus we started the Human Meme Project (the name an innuendo on mixing culture and genetics). We collected all available links to images that had been posted on social networks together with the meta data that would go with these posts, like date and time, language, count of followers, etc.

With referers to some 100 million images, we could then look into the interesting question: how would “the real memes” get propagated and could we see differences in certain types of images regarding their pattern of propagation. Soon we detected several distinct pathes of content being spread. And after having done this for a while, these propagation patterns could tell us often more facts about an image than we could have extracted of the caption or the post’s text.

Case 1: detection of “Astroturfing” and “Twitter-bombing

Of course this kind of analysis is not limited to pictorial content. A good example how the insights of propagation analyses can be used is shown in sciencenews.org. Astroturfing or Twitter-bombing – flooding discussions with messages that would seam to be angry and very critical towards some candidate or some position, and would look like authentic rage at first sight, although in reality it would be machine generated Spam – could pose a thread to political discussion in social networks and even harm democratic elections.
This new type of “Black PR”, however can be detected by analysing the propagation pattern.

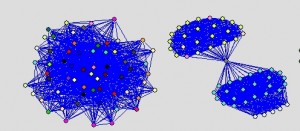
Two examples of how memetic images are shared within communities. The vertices represent the shared images, edges connect images posted by the same user. The left graph results of a set of images that get propagated with almost equal probability in the supporting community, the right graph shows an image that made its path into two disjoint communities before getting further spread.

Case 2: identification of insurgent pamphletesy

After the first wave of uprising in Northern Africa, the remaining regimes became more cautious and installed many kinds of surveillance and filter technologies on the Net. To avoid the governmental crawlers, insurgents started to write their pamphletes by hand in some calligraphic type that no OCR would decipher. These handwritten notes would get photographed and then posted on the social web with some insuspicous text. But what might have tricked out spooks in the good old times, would not deceive the data scientist. These calls for protests, although artfully disguised, leave a distinct trace on their way through Facebook, Twitter and the like. It is not our intention to deliver our findings to the tyrants to close their gap in surveillance. We are in fact convinced that similar approaces are already in place in many authoritarian regimes (and maybe some democracies as well). Thus we think the fact should be as widespread and recognised as possible.

Both examples show again, that just looking at the containers and their dynamic can be as fruitful to tell about their content, than a direct approach.

In the future we won’t be advertising to humans any more.

The future of advertising after Siri – or: posthuman advertising.
by Benedikt Koehler and Joerg Blumtritt

The Skynet Funding Bill is passed. The system goes on-line August 4th, 1997. Human decisions are removed from strategic defense. Skynet begins to learn at a geometric rate. It becomes self-aware at 2:14 a.m. Eastern time. (Terminator 2: Judgment Day, 1991)

The advent of computers, and the subsequent accumulation of incalculable data has given rise to a new system of memory and thought parallel to your own. Humanity has underestimated the consequences of computerization. (Ghost in the Shell, 1996)

Are you a sentient being? – Who cares whether or not I am a sentient being. (ELIZA, 1966)

“Throughout human history, we have been dependent on machines to survive.” This famous punch-line from “The Matrix” summarizes what Canadian media philosopher Herbert Marshall McLuhan had brought to the mind of his time: Our technology as our culture cannot be separated from our physical nature. Technology is an extension of our body. Quite commonly quoted are his examples of wheels being an extension of our feet, clothes of our skin, or the microscope of our eyes. Consequently, McLuhan postulated, that electronic media would become extensions to our nervous system, our senses, our brain.

Advertising as we know it

Advertising means deliberately reaching consumers with messages. We as advertisers are used to sending an ad to be received through the senses of our “target group”. We chose adequate media – the word literally meaning “middle” or “means” – to increase the likelihood of our message to be viewed, read or listened to. After our targets would have been contacted in that way, we hope, that by a process called advertising psychology, their attitudes and finally actions would be changed in our favor – giving consumers a “reason why” they should purchase our products or services.

The whole process of advertising is obviously rather cumbersome and based on many contingencies. In fact, although hardly anyone would disagree in consumption as a necessary or even entertaining part of their lives, almost everyone is tired of the “data smog” as David Shenk calls it receiving between 5,000 and 15,000 advertising messages every day. Diminishing effectiveness and rising inefficiency is the consequence of our mature mass markets, cluttered with competing brands. Ad campaigns fighting for our attention ever more often can be experienced as SPAM. To get through, you have to out-shout the others, to be just more visible, more present in your target group’s life. The Medium is the Massage” as McLuhan himself twisted his own famous saying.

Enter Siri

When Apple launched the iPhone 4s, the OS had incorporated a peculiar piece of software, bearing the poetical name Siri (the Valkyrie of victory). At first sight, Siri just appears to be some versatile interface that allows controlling the device in a way much closer to natural communication. Siri has legendary ancestors, stemming from DARPA’s cognitive agents program. Software agents have been around for some time. Normally we experience them as recommendation engines in shop systems such as Amazon or Ebay, offering us items the agent would guess fitting our preferences by analyzing our previous behavior.

Such preference algorithms are part of a larger software and database concept, usually called agents or daemons in the UNIX context. Although there is no general definition, agents should to a certain extent be self-adapting to their environment and its changes, be able to react to real world or data events and interact with users. Thus agents may seem somewhat autonomous. Some fulfill monitoring or surveillance tasks, triggering actions after some constellation of inputs occurs, some are made for data mining, to recognize patterns in data, others predict users’ preferences and behavior such as shopping recommendation systems.

Siri is apparently a rather sophisticated personal agent that is monitoring not only the behavior on the phone but also many other data sources available through the device. You might e.g. tell Siri : “call me a cab!” – and the phone will autodial to the local taxi operator. Ever more often, people can be watched, standing at the corner, of some street muttering in their phones: “Siri, where am I?” And Siri will dutifully answer, deploying the phone’s GPS data.

Our personal Agents

Agents like Siri are creating a form of representation of ourselves data-wise. These representations – we might also call them ‘avatars’ – are not arbitrarily shaped like the avatars we might take in playing multiuser games like World of Warcraft. It is not us willingly giving them shape but it is algorithms taking what information they might get about us to project us into their data-space. This is similar what big data companies like Google or Facebook do by collecting and analyzing our search inputs, our surfing behavior or our social graph. But in the case of personal agents, the image that is created from our data is kept in cohesion, stays somehow material, becoming even personally addressable. Thus these avatars become more and more simulacra of ourselves, projections of our bodily life into the data-sphere.

We hope the reader notices the fundamental difference between algorithms, predicting something about us from some date collected about us or generalized from others’ behavior like we find with advertising targeting or retail recommendations. In the case of our avatar, we really take the agent as a second skin, made from data.

And suddenly, advertising is no longer necessary to promote goods. Our avatar is notified of offerings and made proposals for sales. It can autonomously decide what it would find relevant or appropriate, just the way Google would decide in our place what web-page to rank higher or lower in our search results. Instead of getting our bodily senses’ attention for the ad’s message, the advertiser has now to fulfill the new task of persuading our avatar’s algorithms of the benefits of the good to be advertised for.

Instead of using advertising psychology, the science of getting into someone’s minds by using rhetoric, creation, media placements etc., will advertising will be hacking into our avatars’ algorithms. This will be very similar to today’s search engine optimization. Promoting new goods would be trying to get into the high ranks of as many avatars’ preferences as possible. Of course, continuous business would only be sustained, if the product would be judged satisfying by our avatar when taken into consideration.

A second skin

But why stop at retail? Our avataric agents will be doing much more for us – for the better or the worse. Apart from residual bursts of spontaneity that might lead us to do things at will – irrationally – our avatars could take over to organizing our day to day lives, make appointments for us, and navigate us through our business. It would pre-schedule dates for meetings with our peers according to our preferences and the contents of our communication it continuously monitors.

You could imagine our data-skin as some invisible aura, hovering around our physical body in an extra dimension. Like a telepathic extension of our senses, the avatars would make us aware of things not immediately present – like someone trying to reach out to us or something that would have to be done now. And although this might sound at first spooky, we are in fact not very far from these experiences: our social media timeline, the things we recognize in the posts of our friends and other people, we follow on Facebook, Twitter or Google+ already tend to connect us to others in a continuous and non-physical way. Just think of this combined with our personal assistants – like the calendars and notices we keep on our devices – and with the already quite advanced shop-agents on Amazon and other retailers – and we have arrived in an post-human age of advertising. This only requires one thing to be built before our avatar is complete: we need standardized APIs, interfaces that would suck the data of various sources into our avatar’s database. Thus every one of us would become a data kraken of our own. And this might be, what ‘post privacy’ is finally all about

Pastagram

While preparing and arranging today’s meal – Penne al Forno con Polpettine – to be documented and posted on Instagram, I thought: Why not preparing and arranging a pasta network with the help of the Instagram API and the Gephi network visualization software. I did this before for many other things such as Chinese cities or spring.

The special Instagram magic lies in the hashtags users are posting to their (and their friends’) images. These hashtags can be used to create social network datasets out of the image streams of the API. If someone is posting an image of their pasta dish and is tagging it with “#salmon”, then this tag is the link to all other images also tagged with “#salmon”. Theoretically one could do the next search for salmon and find out which images are referred to by this hashtag. This would produce a large map of human concepts plus their visualization in photographs.

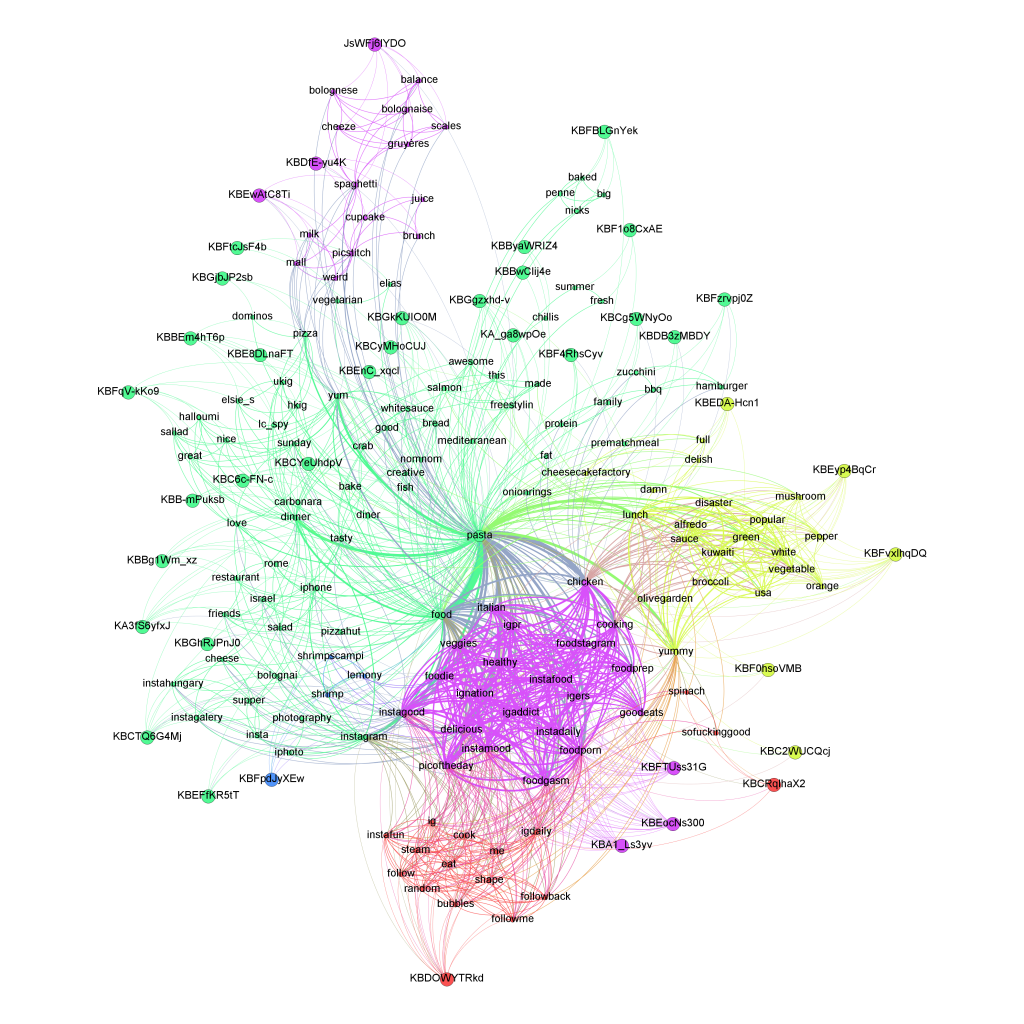
What I did was taking a really small sample of 40 pasta images posted to Instagram during the last week and calculated the links between a) images and b) hashtags. The result is a bimodal network: images are connected to hashtags; and hashtags are connected to images and other hashtags. This is the resulting network:

Pasta Social Network Analysis

I also created a version with all the images in the network as thumbnail, so you can see the different qualities in the image (brightness, colours, composition, filters etc.) Right now I am working an a way to automatically assemble and publish image based networks that would properly embed the images.

Some facts about pasta imagery on Instagram:

  • There’s dinner pasta (upper left) and lunch pasta (upper right). Lunch pasta tends to be more colorful and bright, while dinner pasta can be very dim arrangements on restaurant tables or unboxed pizza and pasta deliveries.
  • Another interesting category is tagged with “distasters”. This hashtags clearly corresponds to the images.
  • The most important hashtags are: pasta, food, chicken, foodporn, delicious, italian, cooking, yummy, foodgasm, foodie.
  • When looking at a larger sample of pasta pictures, the most important hashtags change a bit, but our small sample seems to be quite representative: pasta, food, foodporn, yummy, lunch, dinner, delicious, yum, italian, cheese, spaghetti, homemade …
  • Filters are very frequently used in pasta photography: only 22% of all images are posted without any filters.

Finally, here’s a look at the top five pasta images:

4 out of 5 are photographed by Japanese IGers. So the next thing to look at will be the regional distribution of food hashtags. To be continued.

Twitter Germany will be based in Berlin – Taking a look at the numbers

What I really love about Twitter is that everything they do seems to be data-based. They’re so data-driven, they even analyze the ingredients of their lunch to ensure everyone at the company is living a healthy lifestyle. So, the decision for Berlin as their German headquarter cannot be a random or value-based decision. I bet, there’s been a lot of numbers crunching before announcing their new office. Let’s try and reverse-engineer this decision.

As a data basis I collected 4,377,832 tweets more or less randomly by connecting to the streaming API. Then I pulled all users mentioning one of the 30 leading German cities from Berlin to Aachen in their location field. Where there were Umlauts involved, I allowed for multiple variants, e.g. “Muenchen”, “Munchen” or “Munich” for “München”. Now I have 3,696 Twitter users from Germany that posted one or more tweets during the sample interval. That’s 0.08% of the original sample size. Although that’s not as much as I would have expected, let’s continue with the analysis.

The first interesting thing is the distribution of the Twitter users by their cities. Here’s the result:
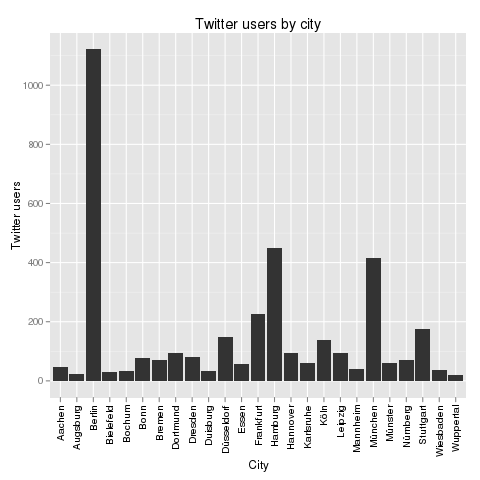
Twitter users by city

One thing should immediately be clear from this chart: Only Berlin, Hamburg and Munich had a real chance of becoming Twitter’s German HQ. The other cities are just Twitter ghost towns. In the press, there had been some buzz about Cologne, but from these numbers, I’d say that could only have been desinformation or whishful thinking.

The next thing to look at is the influence of Twitter users in different German cities. Here’s a look at the follower data:
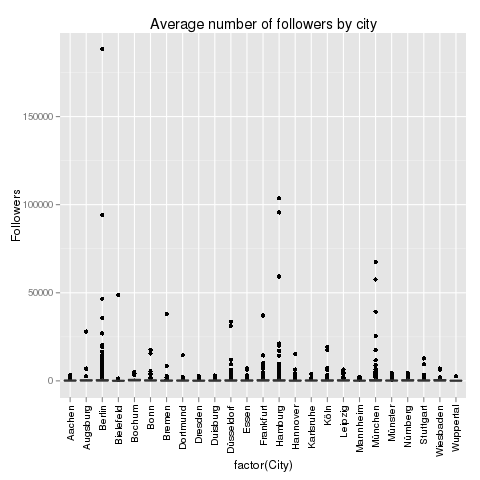
Average numbers of followers by city

This does not help a lot. The distribution is heavily distorted by the outliers: Some Twitter users have a lot more followers than others. These Twitter users are marked by the black dots above the cities. But one thing is interesting: Berlin, Hamburg and Munich not only have the most Twitter users in our sample, but also the most and the highest outliers. With the outliers removed, the chart looks like this:
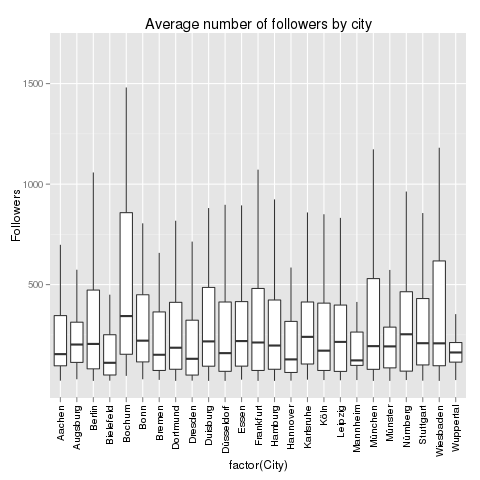
Average number of followers by city

The chart not only shows the median number of followers, but also the distribution of the data. Berlin, that should be clear from this chart, is not the German city where the Twitter users with most followers hail from. This should be awarded to Bochum (355 followers), Nuremberg (258 followers) or Augsburg (243 followers). But these numbers are not very reliable as the number of cases is quite low for these cities. If we focus on the Big 3, then Berlin is leading with 223 followers, then Munich with 209 followers and finally Hamburg with 200 followers. But it’s a very close race.

Next up, the number of friends. Which German city is leading the average number of friends on Twitter?
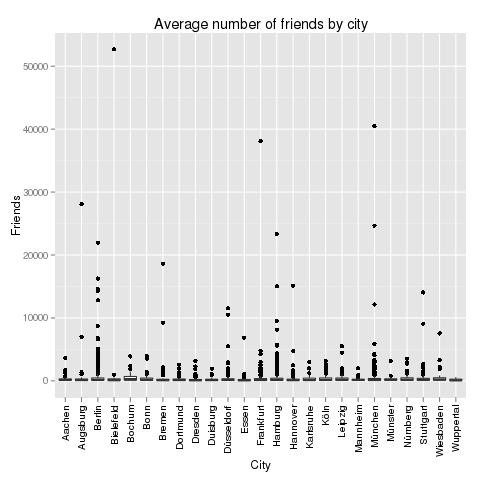
Average number of friends by city

This chart is also distorted by outliers, but here it’s different cities: The user in the sample who is following the largest number of friends is located in Bielefeld. Of all things! Now, let’s remove the outliers:
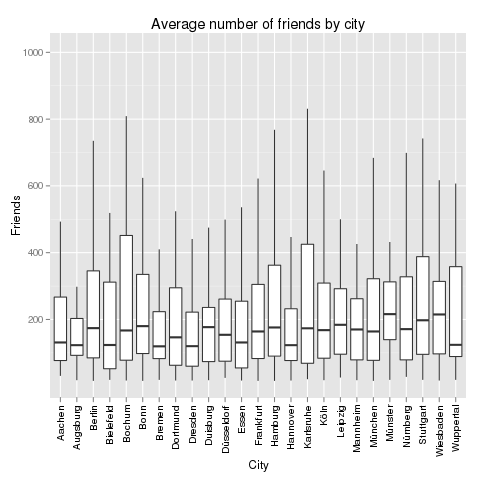
Average number of friends by city

The cities with the larges average number of friends are: Bochum (again! 286 friends), Wiesbaden (224 friends) and Leipzig (208 friends). Our Big 3 are performing as follows: Berlin (183 friends), Hamburg (183 friends) and Munich (160 friends). Let’s take a look at the relation between followers and friends:
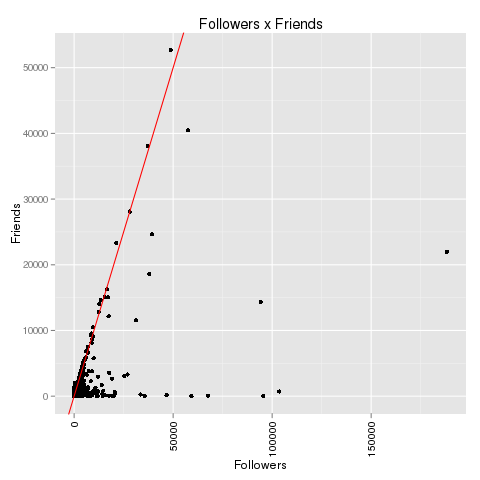
Followers x Friends

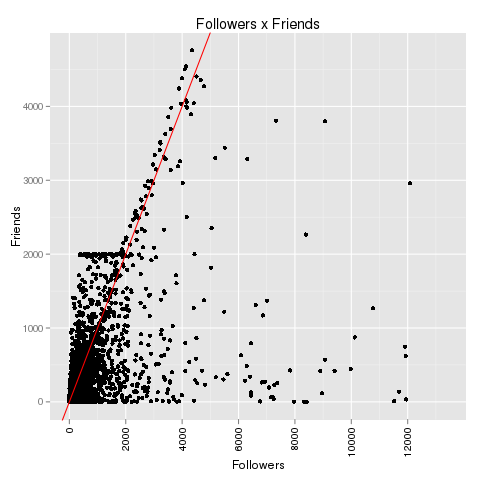
If we zoom in a bit on the data we can reproduce the “2000 phenomenon”:
2000 phenomenon

There clearly is some kind of artificial barrier at 2,000 friends on Twitter. Accounts that have between 100 and 2,000 followers never follow more than 2,000 followers. Most frequently, they follow just a little below of 2,000 people. After they gathered 2,000 followers themselves, this barrier has been broken and the maximal number of friends seems to grow with the number of followers. There’s only speculation about this phenomenon, but one of the most convincing explanation is: We are looking at spam bots that are programmed to stay below 2,000 friends until they have gathered more than 2,000 followers. Maybe Twitter has some spam fighting algorithms that are focusing at the 2,000 line. Update: See explanation in the comments to this article: Behind this anomaly is Twitter’s spam-fighting barrier that only allows 2,000 friends up to 2,000 followers. Beyond this, the limit for the maximum number of friends is limited by the number of followers + 10%.

If those users are bots, then which city is bot capital? Let’s take a look at all Twitter users that have between 1,900 and 2,100 friends and segment them by city:
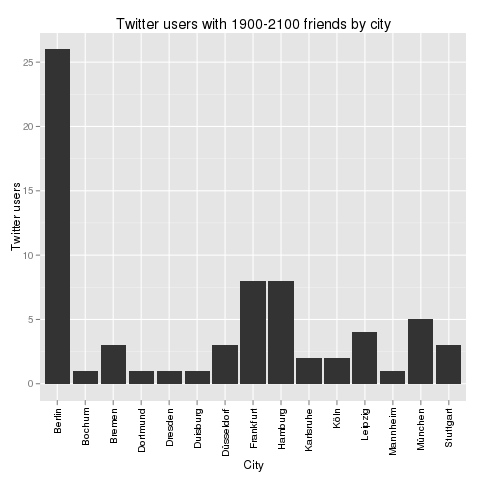
Twitter users by city

Again, Berlin is leading. But how do these numbers relate to the total numbers? Here’s the Bot Score for these cities: Berlin 2.3%, Hamburg 1.8% and Munich 1.2%. That’s one clear point for Munich.

Finally, let’s take a look at Twitter statuses in these cities. Where do the most active Twitter users tweet from? Here’s a look at the full picture including outliers:
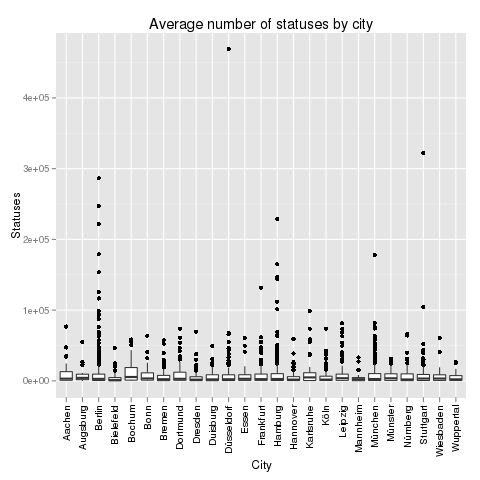
Average number of statuses by city

The city with the most active Twitter user surprisingly is not Bochum or Berlin, but Düsseldorf. And also Stuttgart seems to be very hot in this regard. But to really learn about activity, we have to remove the outliers again:
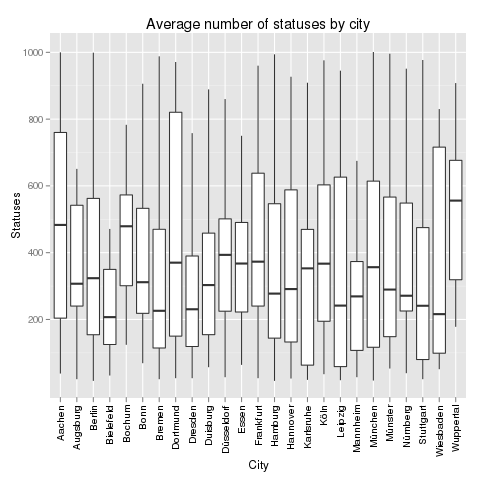
Average number of statuses by city

Without outliers, the most active Twitter cities in Germany are: Bochum (again!! 5514 statuses), Karlsruhe (4973) and Augsburg (4254). The Big 3 are in the midfield: Berlin (2845), Munich (2717) and Hamburg (2638).

Finally, there’s always the content. What are the users in the Big 3 cities talking about? The most frequently twittered words do not differ very much. In all three cities, “RT” is the most important word followed by a lot of words like “in”, “the” or “ich” that don’t tell much about the topics. It is much more interesting to look at word pairs (and especially at the pairs with the highest point wise mutual information (PMI). In Berlin, people are talking about “neues Buch” (new book – it’s a city of literature), “gangbang erotik” (hmm) and “nasdaq dow” (financial information seem to be important). In Munich, it’s “reise reisen” (Munich seems to love traveling), “design products” (very design oriented city) and “prost bier” (it’s a cliche, but it seems to be true). Compare this with Hamburg’s “amazon preis” (people looking for low prices), “social media” (Hamburg has a lot of online agencies) and “dvd blueray” (people watching a lot of TV).

Wrapping up, here are the final results:

          Berlin Munich Hamburg
Users          3      1       2
Followers      3      2       1
Friends        2      1       2
Bots          -3     -1      -2
Statuses       3      2       1
TOTAL          8      5       4

Congrats to Berlin!

[The R code that generated all the charts above can be found on my github.]
Telling stories with network data: Spring on Instagram

The days are getting longer, the first flowers come into bloom and a very specific set of hashtags are spreading through Social Media platforms – it’s spring again! In this blogpost I took a look at spring-related pictures on Instagram. Right now, the use of hashtags on Instagram has not entered the mainstream. For this analysis, I took a look at the latest 938 images tagged with “#spring”. The average rate was 12 spring-tagged pictures a day, but this rate will be increasing during the next days and weeks.

The following hashtags were most frequently used in combination with the #spring hashtag:

  1. Flower(s) (198 mentions, 2639 likes)
  2. Sun (160, 2018)
  3. Tree(s) (130, 2230)
  4. Nature (128, 2718)
  5. Love (119, 1681)
  6. Girl (107, 1469)
  7. Sky (89, 2057)
  8. Fashion (64, 924)
  9. Beautiful (61, 1050)
  10. Blue (59, 1234)

Although I would associate spring with green, the Instagram community has other preferences:

  1. Blue (59 mentions, 1234 likes)
  2. Pink (42, 396)
  3. Green (40, 444)
  4. White (29, 457)
  5. Yellow (22, 369)
  6. Red (17, 230)
  7. Black (16, 267)
  8. Brown (7, 117)
  9. Orange (7, 77)
  10. Grey (3, 50)

So these are the spring colors according to Instagram hashtags

Here are the top 15 most liked spring pictures on Instagram right now:

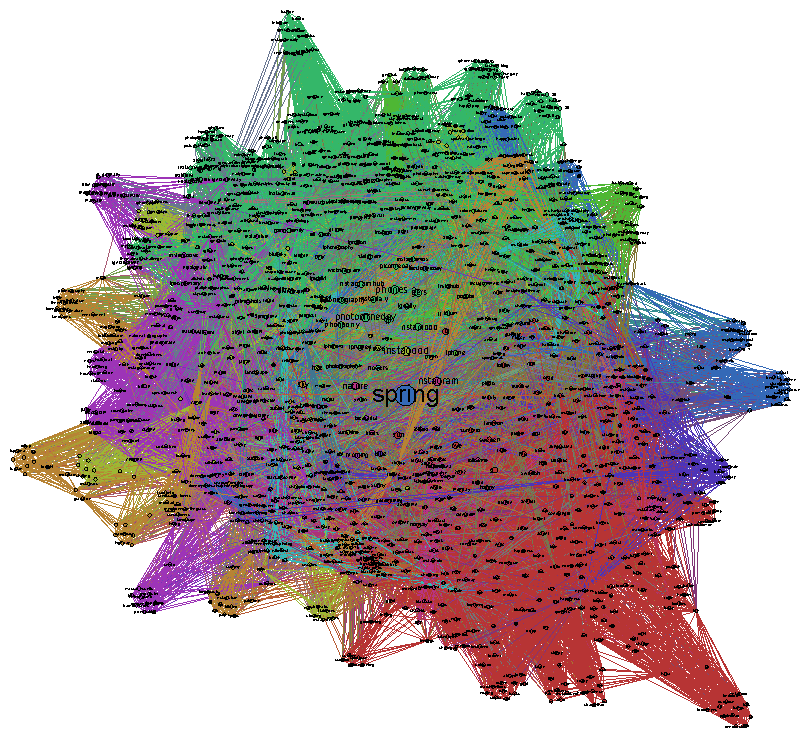
Here’s the tag network that is showing the relations between the 2445 other unique hashtags that appeared in connection with #spring (see PDF):

Instagram wouldn’t be half the fun without the various filters to apply to the images. But #spring is best enjoyed in natural form. 28% of all #spring posts were posted without any additional filter:

  1. Normal (261)
  2. X-Pro II (91)
  3. Rise (83)
  4. Amaro (81)
  5. Lo-fi (68)
  6. Hefe (54)
  7. Earlybird (48)
  8. Hudson (41)
  9. Sierra (34)
  10. Valencia (33)

Strata Conference – the first day

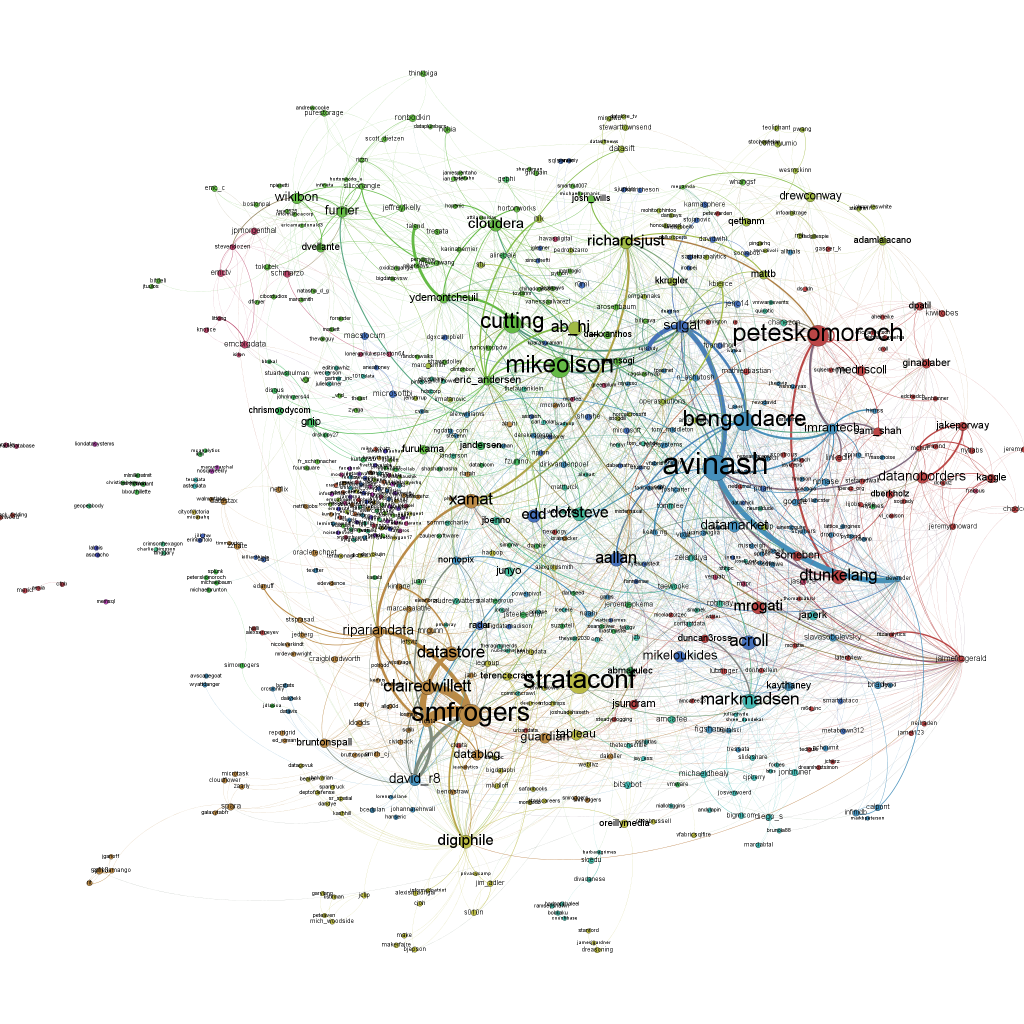
Here’s a network visualization of all tweets referring to the hashtag “#strataconf” (click to enlarge). The node size is representing the number of incoming links, i.e. the number of times this person has been mentioned in other people’s tweets:

This network map has been generated in three steps:

1) Data collection: I collected the twitter data with the open source application YourTwapperKeeper. This is the DIY version of the TwapperKeeper platform that had been very popular in the scientific community. Unfortunately after the acquisition by HootSuite it is no longer available to the general public, but John O’Brien has made the scripts available via his githup. I am running yTK on a Amazon EC2 instance. What it does is connecting to the Twitter Streaming API and fetching all tweets with “#strataconf” in realtime and additionally doing regular searches via the Search API to find tweets that had been overlooked by the Streaming API.

2) Data processing: What is so great about yTK: It offers different methods to fetch the tweets you collected. I am using the JSON API to get the tweets downloaded to my computer. This is done with a Python script. The script opens the JSON file and then scans the tweets for mentions or retweets with the following regular expressions I borrowed from Matthew Russell’s book Mining the Social Web:

rt_patterns = re.compile(r"(RT|via)((?:\b\W*@\w+)+)", re.IGNORECASE)
at_pattern = re.compile(r"@(\w+)", re.IGNORECASE)

Then I am using the very convenient library igraph to write the results in the generic graphml file format that can be processed by various network analysis tools. Basically I am just using this snipped of code on all tweets I found to generate the list of nodes:

if not tweet['from_user'].lower() in nodes:
    nodes.append(tweet['from_user'].lower())

… and edges:

for mention in at_pattern.findall(tweet['text']):
    mentioned.append(mention.lower())
    if not mention.lower() in nodes:
        nodes.append(mention.lower())
    edges.append((nodes.index(tweet['from_user'].lower()),nodes.index(mention.lower())))

The graph is generated with the following lines of code:

g = Graph(len(nodes), directed=True)
g.vs["label"] = nodes
g.add_edges(edges)

This is almost the whole code for processing the network data.

3) Visualization: The visualization of the graph is done with the wonderful cross-platform tool Gephi. To generate the graph above, I reduced the network to all nodes that have at least one other node referring to it. Then I sized the nodes according to their total number of degrees, that is how often they were mentioned in other people’s tweets or how often they were mentioning other users. The color is determined by the modularity clustering algorithm. Then I used the Force Atlas layout algorithm and voilà – here’s the network map.