Anomaly Detection with Wikipedia Page View Data

Today, the Twitter engineering team released another very interesting Open Source R package for working with time series data: “AnomalyDetection“. This package uses the Seasonal Hybrid ESD (S-H-ESD) algorithm to identify local anomalies (= variations inside seasonal patterns) and global anomalies (= variations that cannot be explained with seasonal patterns).

As a kind of warm up and practical exploration of the new package, here’s a short example on how to download Wikipedia PageView statistics and mine them for anomalies (inspired by this blog post, where this package wasn’t available yet):

First, we install and load the necessary packages:

library(RJSONIO)
library(RCurl)
library(ggplot2)
install.packages("devtools")
devtools::install_github("twitter/AnomalyDetection")
library(AnomalyDetection)

Then we choose an interesting Wikipedia page and download the last 90 days of PageView statistics:

page <- "USA"
raw_data <- getURL(paste("http://stats.grok.se/json/en/latest90/", page, sep=""))
data <- fromJSON(raw_data)
views <- data.frame(timestamp=paste(names(data$daily_views), " 12:00:00", sep=""), stringsAsFactors=F)
views$count <- data$daily_views
views$timestamp <- as.POSIXlt(views$timestamp) # Transform to POSIX datetime
views <- views[order(views$timestamp),]

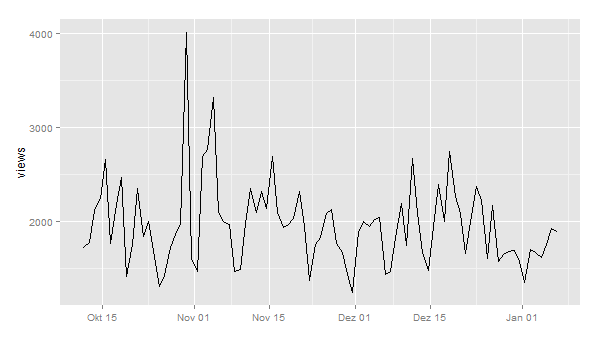
I also did some pre-processing and transformation of the dates in POSIX datetime format. A first plot shows this pattern:

ggplot(views, aes(timestamp, count)) + geom_line() + scale_x_datetime() + xlab("") + ylab("views")
wikipedia_views_USA

Now, let’s look for anomalies. The usual way would be to feed a dataframe with a date-time and a value column into the AnomalyDetection function AnomalyDetectionTs(). But in this case, this doesn’t work because our data is much too coarse. It doesn’t seem to work with data on days. So, we use the more generic function AnomalyDetectionVec() that just needs the values and some definition of a period. In this case, the period is 7 (= 7 days for one week):

res = AnomalyDetectionVec(views$count, max_anoms=0.05, direction='both', plot=TRUE, period=7)
res$plot
wikipedia_anomalies_usa

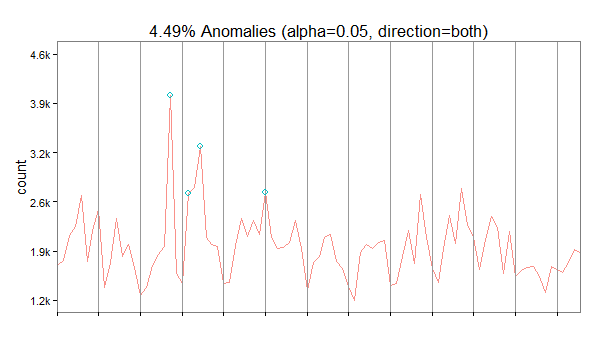
In our case, the algorithm has discovered 4 anomalies. The first on October 30 2014 being an exceptionally high value overall, the second is a very high Sunday, the third a high value overall and the forth a high Saturday (normally, this day is also quite weak).

Social Network Analysis of the Twitter conversations at the WEF in Davos

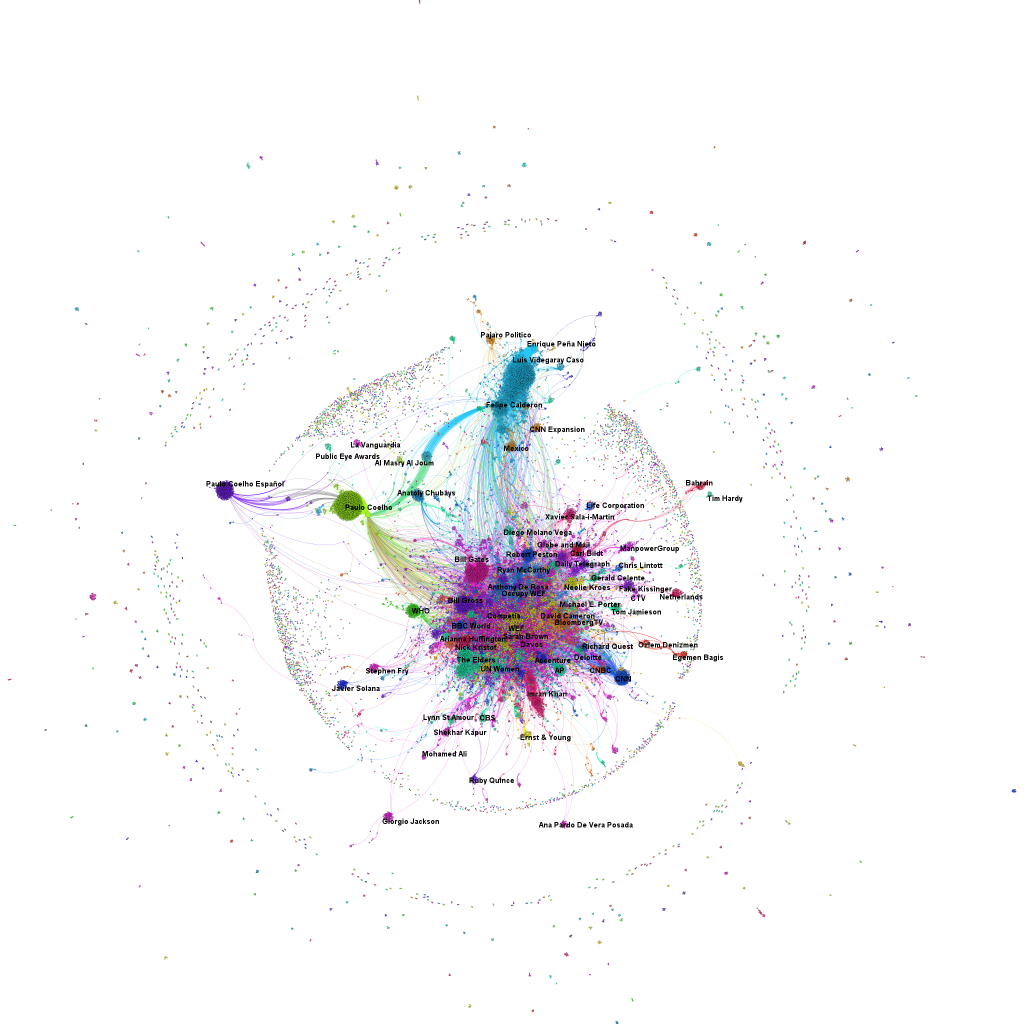
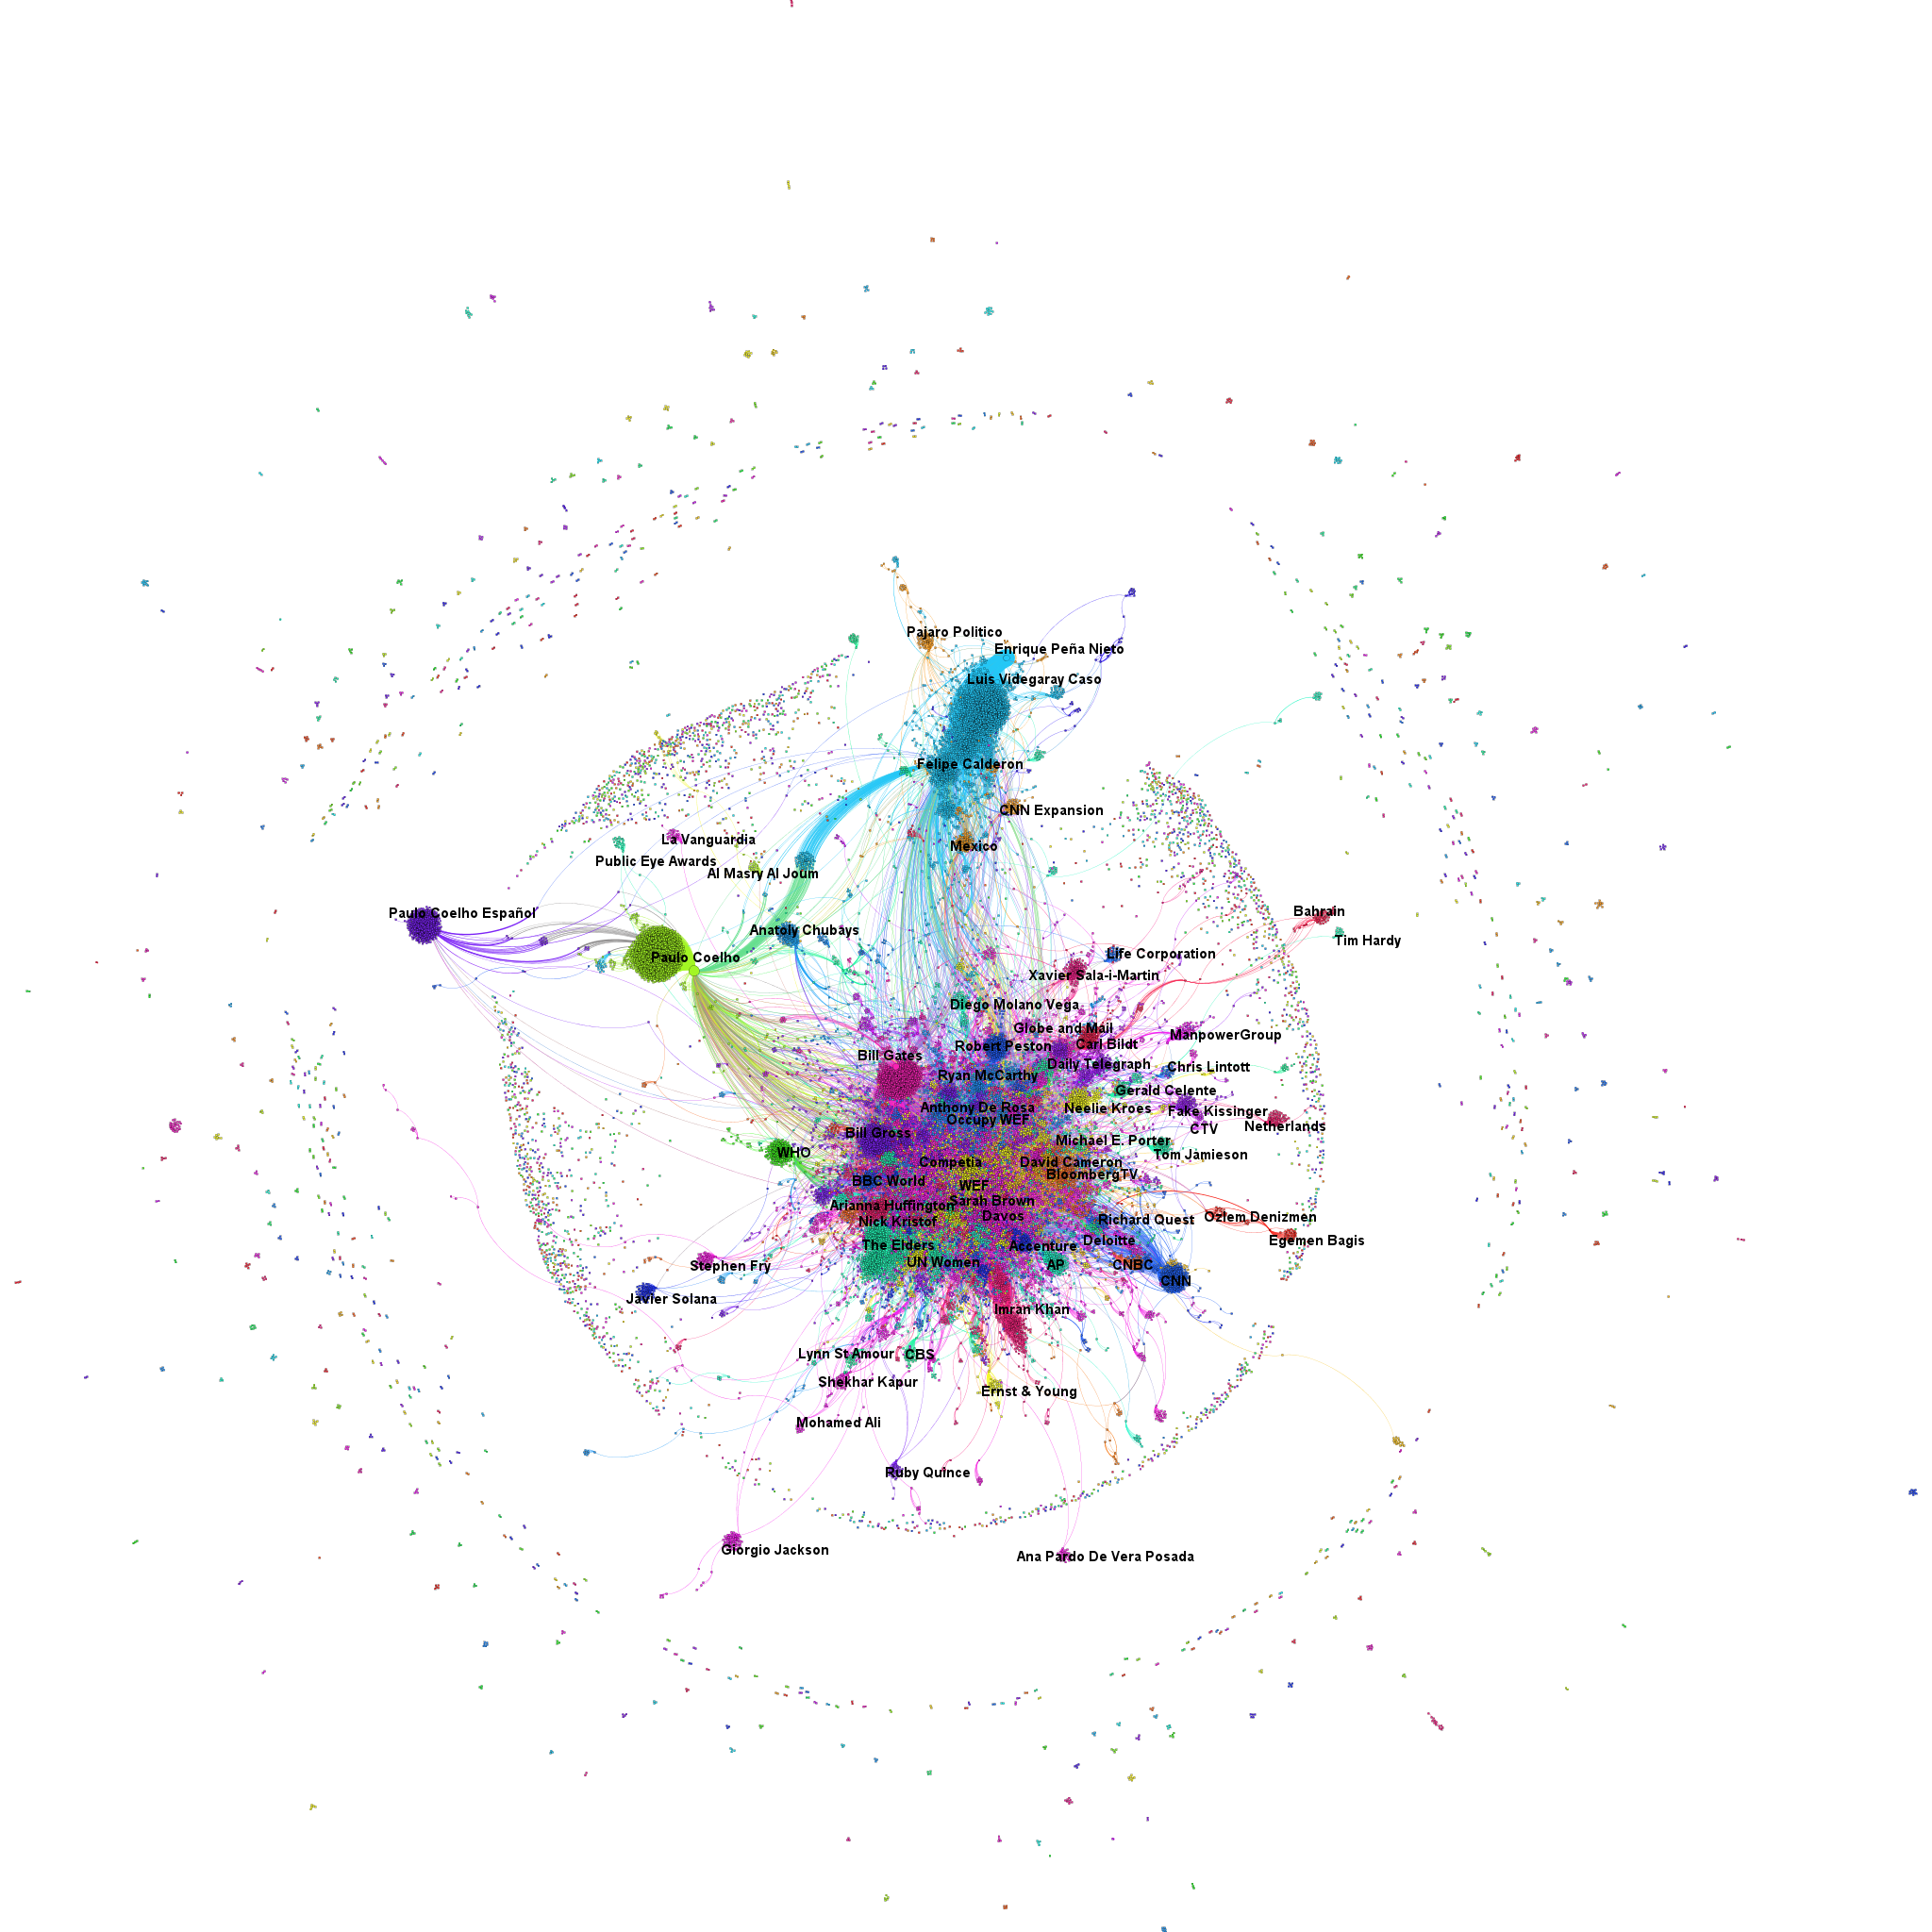
The minute, the World Economic Forum at Davos said farewell to about 2,500 participants from almost 100 countries, our network analytical machines switched into production mode. Here’s the first result: a network map of the Twitter conversations related to the hashtags “#WEF” and “#Davos”. While there are only 2,500 participants, there are almost 36,000 unique Twitter accounts in this global conversation about the World Economic Forum. Its digital footprint is larger than the actual event (click on map to enlarge).

There are three different elements to note in this visualization: the dots are Twitter accounts. As soon as somebody used one of the two Davosian hashtags, he became part of our data set. The size of the notes relates to its influence within the network – the betweenness centrality. The better nodes are connecting other nodes, the more influential they are and the larger they are drawn. The lines are mentions or retweets between two or more Twitter accounts. And finally, the color refers to the subnetworks or clusters generated by replying or retweeting some users more often than others. In this infographic, I have labelled the clusters with the name of the node that is in the center of this cluster.

Networking at Davos – 1st day

Now, that the World Economic Forum at Davos has started, also the conversational buzz on Twitter is increasing. While yesterday news agencies and journalists dominated the buzz, this morning (data ranging from 10:15 to 11:40) clearly has been a Paulo Coelho moment. The following tweet has been the most frequently retweeted #WEF tweet:

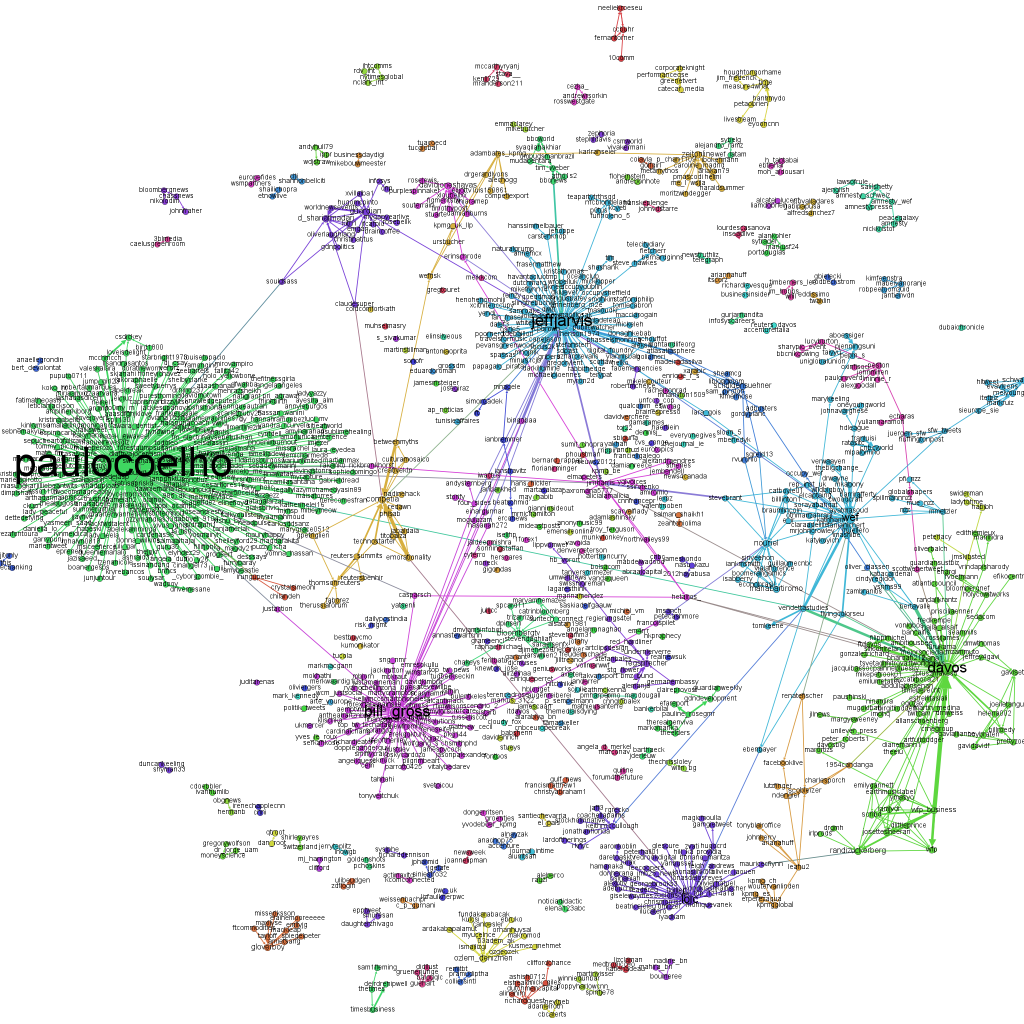
The most mentioned accounts in this time frame have been the following: @paulocoelho (265 mentions and retweets), @jeffjarvis (81), @bill_gross (74), @davos (63) and @loic (39). Interestingly, these five most frequently mentioned accounts did not contribute much to the Davos related Twitter conversations: Paulo Coelho mentioned #WEF in a tweet that has been resounding in the analyzed time frame and Jeff Jarvis did post three tweets. Here’s a visualization of the Twitter users mentioning each other. The larger a node, the more often it has been mentioned by other users.

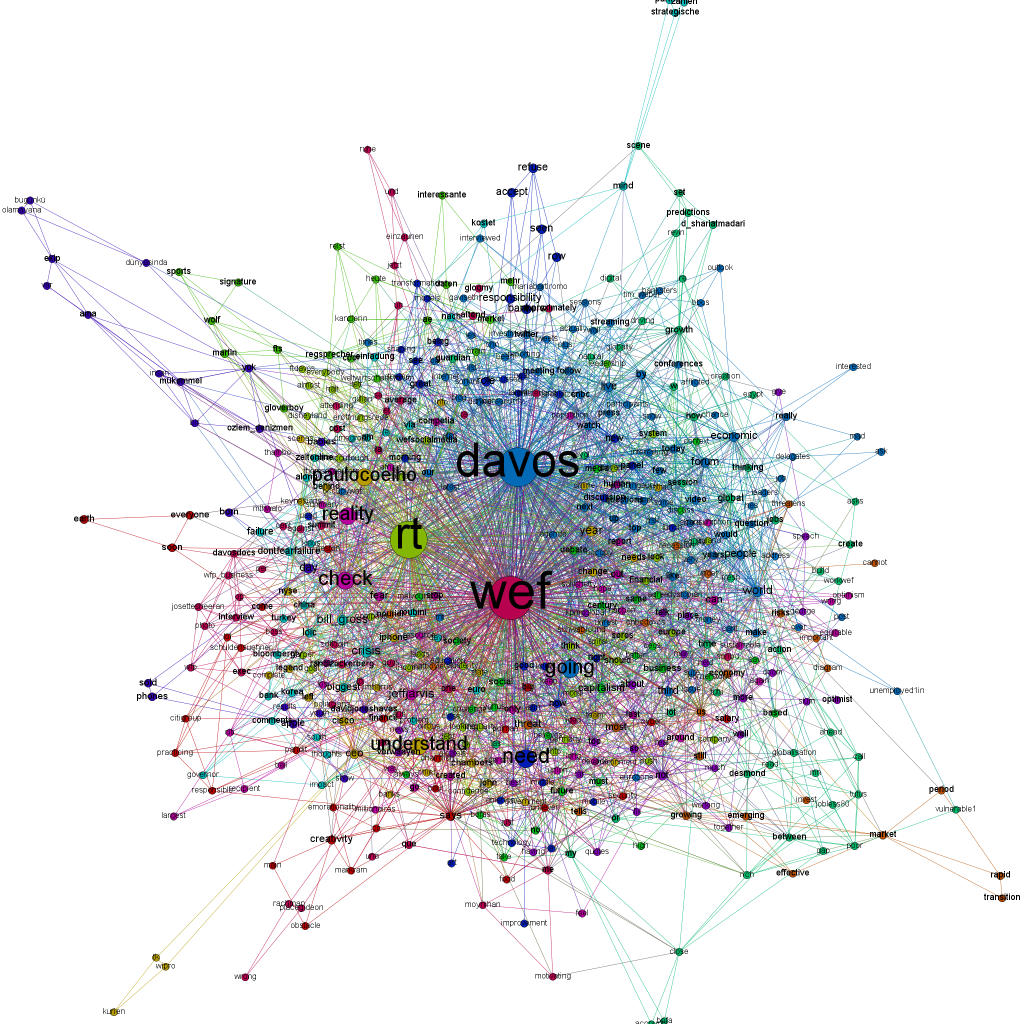
If we take a look at the content, the most frequently mentioned words have been: wef (1001 times), davos (886), rt (= retweet, 827), need (301 times) and going (281 times). The last two words are clearly related to Paulo Coelhos tweet mentioned above. Other interesting words that have been connected to WEF and Davos are: crisis (89 times), world (88), bankers (61), responsibility (57), people (55), refuse (55), CEO (51) and fear (49):