Memes – images, jokes, content snippets that get spread virally on the net – have been a popular topic in the Net’s pop culture for some time. A year ago, we started thinking about, how we could operationalise the Meme-concept and detect memetic content. Thus we started the Human Meme Project (the name an innuendo on mixing culture and genetics). We collected all available links to images that had been posted on social networks together with the meta data that would go with these posts, like date and time, language, count of followers, etc.
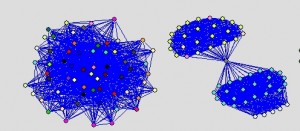
With referers to some 100 million images, we could then look into the interesting question: how would “the real memes” get propagated and could we see differences in certain types of images regarding their pattern of propagation. Soon we detected several distinct pathes of content being spread. And after having done this for a while, these propagation patterns could tell us often more facts about an image than we could have extracted of the caption or the post’s text.
Case 1: detection of “Astroturfing” and “Twitter-bombing
Of course this kind of analysis is not limited to pictorial content. A good example how the insights of propagation analyses can be used is shown in sciencenews.org. Astroturfing or Twitter-bombing – flooding discussions with messages that would seam to be angry and very critical towards some candidate or some position, and would look like authentic rage at first sight, although in reality it would be machine generated Spam – could pose a thread to political discussion in social networks and even harm democratic elections.
This new type of “Black PR”, however can be detected by analysing the propagation pattern.
Case 2: identification of insurgent pamphletesy
After the first wave of uprising in Northern Africa, the remaining regimes became more cautious and installed many kinds of surveillance and filter technologies on the Net. To avoid the governmental crawlers, insurgents started to write their pamphletes by hand in some calligraphic type that no OCR would decipher. These handwritten notes would get photographed and then posted on the social web with some insuspicous text. But what might have tricked out spooks in the good old times, would not deceive the data scientist. These calls for protests, although artfully disguised, leave a distinct trace on their way through Facebook, Twitter and the like. It is not our intention to deliver our findings to the tyrants to close their gap in surveillance. We are in fact convinced that similar approaces are already in place in many authoritarian regimes (and maybe some democracies as well). Thus we think the fact should be as widespread and recognised as possible.
Both examples show again, that just looking at the containers and their dynamic can be as fruitful to tell about their content, than a direct approach.
