To fill the gap until this year’s Strata Conference in Santa Clara, I thought of a way to find out trends in big data and data science. As this conference should easily be the leading edge gathering of practitioners, theorists and followers of big data analytics, the abstracts submitted and accepted for Strataconf should give some valuable input. So, I collected the abstracts from the last Santa Clara Strata conferences and applied some Python nltk magic to it – all in a single IPython Notebook, of course.
Here’s a look at the resulting insights. First, I analyzed the most frequent words, people used in their abstracts (after excluding common English language stop words). As a starter, here’s the Top 20 words for the last four Strata conferences:
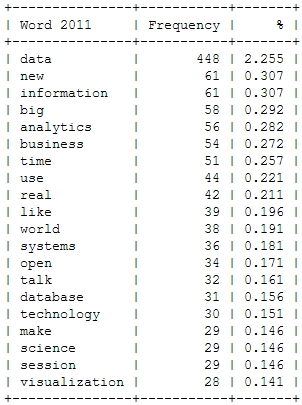
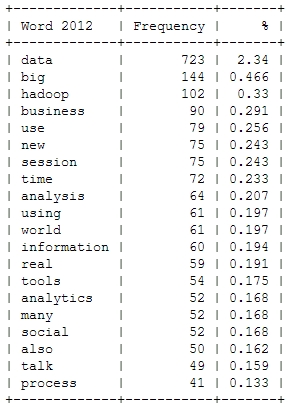
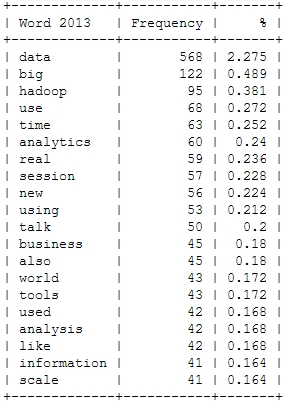
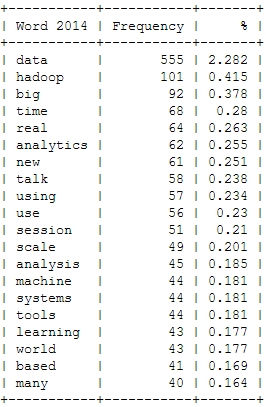
This is just to check, whether all the important buzzwords are there and we’re measuring the right things here: Data – check! Hadoop – check! Big – check! Business – check! Already with this simple frequency count, one thing seems very interesting: Hadoop didn’t seem to be a big topic in the community until 2012. Another random conclusion could be that 2011 was the year where Big Data really was “new”. This word loses traction in the following years.
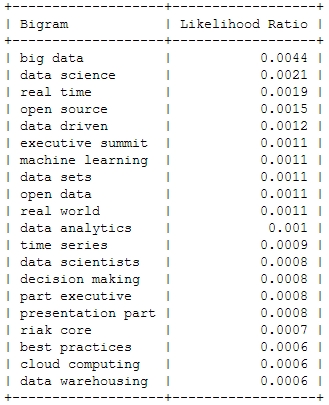
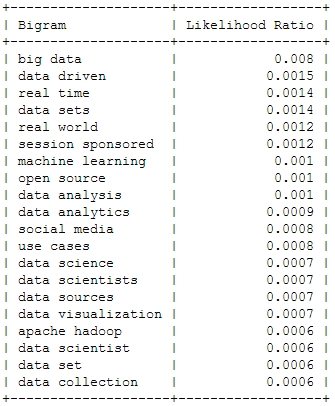
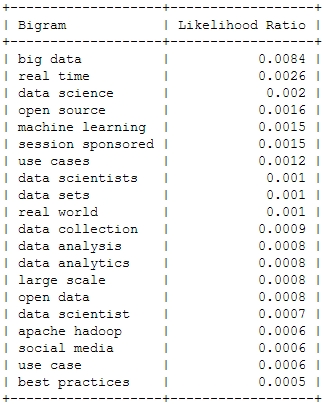
And now for something a bit more sophisticated: Bigrams or frequently used word combinations:
2011
2012
2013
2014

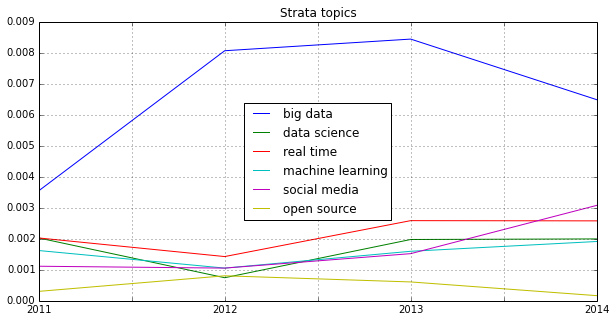
Of course, the top bigram through all the years is “big data”, which is not entirely unexpected. But you can clearly see some variation among the Top 20. Looking at the relative frequency of the mentions, you can see that the most important topic “Big Data” will probably not be as important in this years conference – the topical variety seems to be increasing:
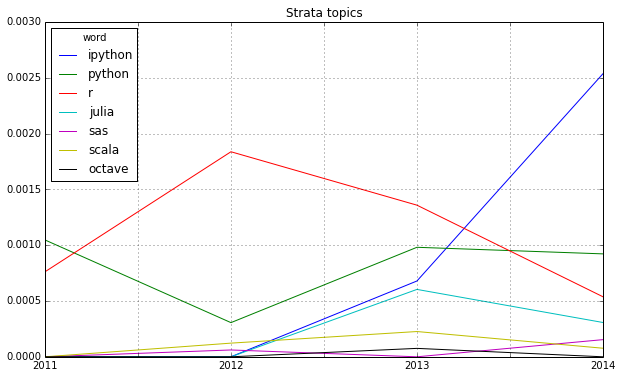
Looking at some famous programming and mathematical languages, the strong dominance of R seems to be broken by Python or IPython (and its Notebook environment) which seems to have established itself as the ideal programming tool for the nerdy real-time presentation of data hacks. \o/
Another trend can be seen in the following chart: Big Data seems to become more and more faceted over the years. The dominant focus on business applications of data analysis seems to be over and the number of different topics discussed on the conference seems to be increasing:

Finally, let’s take a more systematic look at rising topics at Strata Conferences. To find out which topics were gaining momentum, I calculated the relative frequencies of all the words and compared them to the year before. So, here’s the trending topics:

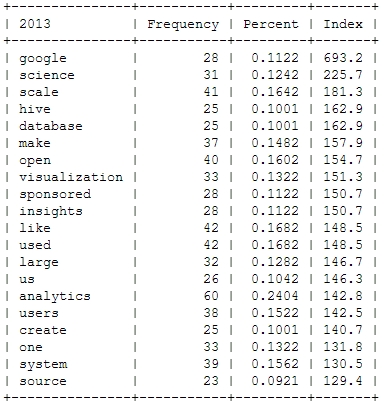
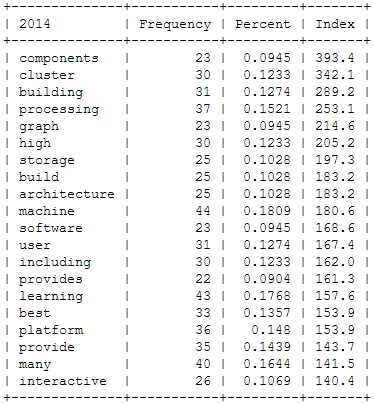
These charts show that 2012 was indeed the “Hadoop-Strata” where this technology was the great story for the community, but also the programming language R became the favorite Swiss knife for data scientists. 2013 was about applications like Hive that run on top of Hadoop, data visualizations and Google seemed to generate a lot of buzz in the community. Also, 2013 was the year, data really became a science – this is the second most important trending topic. And this was exactly the way, I experienced the 2013 Strata “on the ground” in Santa Clara.
What will 2014 bring? The data suggests, it will be the return of the hardware (e.g. high performance clusters), but also about building data architectures, bringing data know-how into organizations and on a more technical dimension about graph processing. Sounds very promising in my ears!
